In sprint automation metrics that you can use to help improve your test automation efficiency and therefore your software development process.

Automated testing is a vital part of any Continuous Integration and Continuous Delivery/Deployment (CI/CD) process. In the fast-paced development environment in which many of us now work, it is vital that teams are provided with fast feedback as to whether their code changes have affected the core functionality or performance of their software in any negative way.
However, test automation can also be a large investment for companies. It is understandable that your company will be looking for ways to identify whether they are getting maximum value out of their test automation efforts. How can we communicate the value of our test automation? One way to do this is to highlight the improvements it has helped your team make to their processes.
It would be irresponsible to write an article on test automation metrics without highlighting some of the pitfalls of measuring metrics. Metrics can be abused. People outside of the team can look at metrics and make judgements on individuals based on those metrics.
Metrics can also be gamed. There is a classic example of a tester being measured on how many new bug reports they write. This can lead to testers becoming metric focused and waste time writing bug reports for unimportant defects.
The metrics I am going to discuss provide valuable information for the development team who are monitoring and reacting to these metrics. They all have a reason for being measured and they aren’t metrics for the sake of metrics. I’m going to share several test automation metrics that you can monitor throughout your sprints to help you evaluate and improve your team’s CI/CD processes.
Time to Run Your Tests
The time it takes your tests to run can be a good automated testing KPI if used sensibly.
As discussed at the beginning of this article, gaining fast feedback is vital for development teams in Agile environments. Once a developer pushes code, fast running tests should be run first so that if there is a failure here, the developer is alerted in the quickest possible time as they will still be engaged in the piece of work that they have just committed. The risk of waiting too long is that they will begin to focus on another task and switch contexts, which can lead to waste.
As software grows so does complexity. This can lead to more tests being added over time and automated test suites becoming bloated. By measuring the time it takes for our tests to run, we can ensure that we are not exceeding the threshold that the team has agreed upon.
For example, your team may agree that five minutes is an acceptable amount of time for end to end tests to run in your pipeline. If you find that over time the time to run these tests has exceeded this then you can begin to evaluate your test suite.
Are all of these tests necessary? Are they providing us with valuable information? Is there anything we can do to speed up our existing tests (e.g. by running the tests in parallel?) Do we need these tests running on every code commit or can they be run less frequently?
Tracking the time it takes your test suite to run is valuable as it leads to you critically evaluating the tests that you are writing. Monitoring the change in test run times can lead to the quality of your test suite improving but more importantly, it can help you improve and extract the most value out of your CI/CD process.
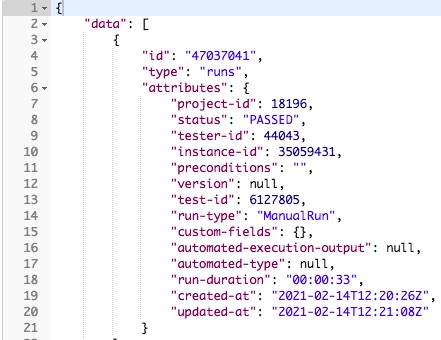
Tools such as PractiTest can be used to monitor the time it takes tests to run, by integrating your automated tests with the PractiTest API. Below is a screenshot of the response from the API.
Number of Tests Passed or Failed
By looking at the numbers of tests passing and failing as features are developed are a useful addition to your in sprint automation metrics.
This one may seem obvious, but by tracking the number of passing and failing tests, we can use this as a guide on feature progress and to ensure that we are designing the feature correctly. This is as much a sprint automation metric as a test automation metric but it provides a lot of value to the team.
For teams practicing BDD, it is common for people from various roles to get together and discuss different scenarios that the software should be able to execute successfully. One output of these sessions is a list of scenarios produced in a Gherkin (Given, When, Then) format. These are often turned into automated tests that can be run in your pipeline and can be added into your automated regression test suite.
The person in the team writing the application code can be working in parallel with the person transforming the BDD scenarios into tests. It’s possible to have these tests created before the application code. The team could agree that a good workflow could be to pull the BDD tests and run them frequently against the code under development. Or this could be done in a feature branch pipeline so as not to interfere with the main development trunk.
By monitoring the number of tests passing and failing the developer can track the progress of the feature they are developing. For example, the first commit of code could see only one out of five tests passing as the feature is in its early stages. But as the developer continues to add more functionality to the feature, they will begin to see more tests pass.
Tracking the number of passing tests also helps keep developers on the right track. The tests can be seen as a scaffolding for the feature they are developing. It’s quite common for misunderstandings to be had on the functionality of a piece of work, but by having the Gherkin scenarios written out and agreed upon with the team, and having the developer run these frequently to see how many pass or fail, it helps to produce the agreed upon desired outcome for the team.
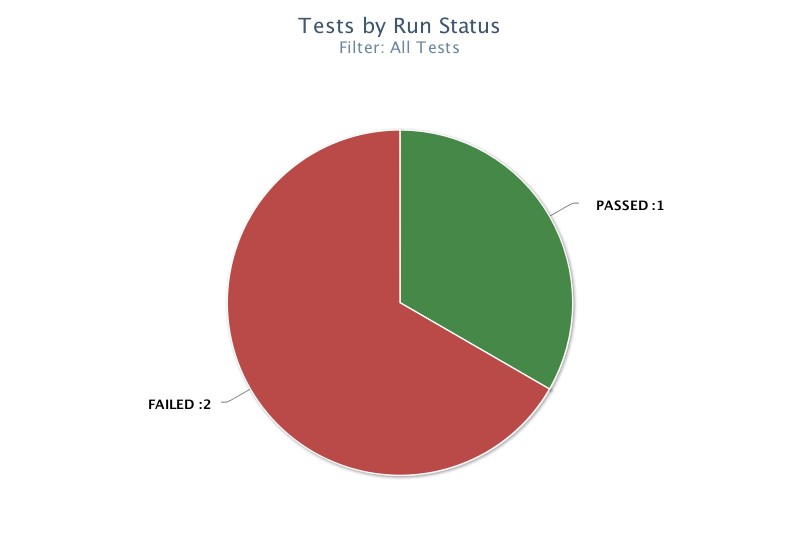
Within PractiTest, you can track the number of passing or failing tests using a dashboard. These dashboards can track the number of passing or failing tests and can also be exported so that non-PractiTest users can see your dashboards.
Bugs Found in Production
By monitoring how many tests from your automated regression coverage fail in production, you can analyse why these failures occurred and identify a potential improvement based on this.
Testing in production would previously have sent shivers down the spines of many software development teams. In the world of CI/CD, running tests in production is a very important thing to be exploring. The speed at which companies need to release software needs to be increased to meet quickly evolving customer and market demands. This can often lead to development cycles being decreased and this includes the time to perform tests.
It’s important to highlight that by testing in production, you are not ignoring testing or other quality practices earlier in the development process. You are simply being smart about where you run those tests and you are also accounting for differences between environment data. It’s all too common for bugs found in production not to be reproducible in test environments due to the difference in the data available.
By having an automated test suite running on production on a frequent basis (after deployment or even nightly) you can have confidence that your software is behaving as expected for your customers.
Finding a bug in production is never a nice thing. It means a flaw has been introduced which can often impact your customers. That’s why tracking the number of bugs found in production is important.
If the number of bugs found by our test suites in production is increasing, then that can highlight a problem. If we see a high severity bug in production, then this is also an issue.
The value of tracking this metric is that it allows you to perform a root cause analysis session. Why did this bug occur? What gaps in our process allowed this to occur? Do we need to add more tests for this scenario? Do we need more realistic test data? Or can we add a step in our development process to prevent this from happening again?
By measuring the number of bugs found in production you can also continually evaluate your team’s processes and begin heading towards continuous improvement.
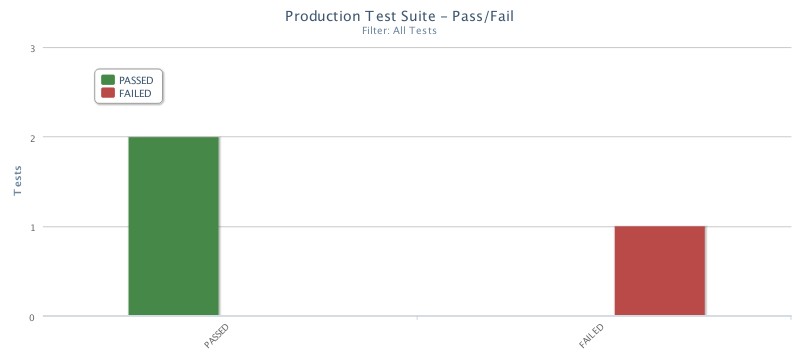
You can achieve this using PractiTest by grouping all of the tests you run in production into a Test Set and creating a dashboard. displaying the number of tests passing and failing within that set.
Test Coverage
Test coverage can be a useful test automation metric as it allows you to see which areas you can add more tests.
The number of tests written for a specific feature or area of functionality is also a common metric used by many teams, but it is often abused or misunderstood. For example, tools which track unit test coverage could display 100% coverage for a specific code component, but it says nothing about the quality of test being written, simply that all lines of code are being exercised by tests.
Tracking the coverage of integration and end to end tests is even more difficult. I tend to look at tracking test coverage as a way of measuring gaps in our test suite. Looking at a piece of functionality and seeing that there are ten tests which cover it tells us very little but looking at a piece of functionality and seeing that there are zero or just one test exercising it can tell us a lot about what is missing.
As with all the metrics discussed in this article, this one requires some critical analysis. We can’t simply say that because a piece of functionality only has one test that we need to add more. But what that number should do is prompt us to ask questions about why there is only one and decide whether we need to add more or whether the effort of adding more is worth it.
Measuring test coverage allows us to use our critical thinking skills and identify potential areas for improvement in our CI/CD process. By identifying areas with low test coverage and increasing this, we can have more confidence that the functionality we are releasing is not introducing any negative aspects to our software.

How Often and Why Tests Fail
By monitoring flaky tests throughout your sprints and fixing the root cause of the failure you can really improve your test automation efficiency.
Creating a reliable and robust set of automated tests takes a lot of time and effort. In an ideal world, once you have written an automated test, the only reason it would fail would be if a genuine problem has been introduced.
This isn’t always the case. Teams often spend a lot of time maintaining and fixing tests which are failing when they shouldn’t be. False failures are frustrating for everyone in the team.
We quite often see the same tests returning these false failures and disrupting the team’s release flow. It’s important to identify these so-called “flaky” tests and fix them. Tests can fail falsely for several reasons; inconsistent test data, poorly written test code or functional code that hasn’t been developed with testability in mind. Tests should be run frequently in your CI/CD pipeline so having tests fail inconsistently creates problems within your team and ultimately leads you to distrust your test results.
Teams can track pass/failure rates for individual tests and highlight the ones which have failed over a certain percentage of times over a defined period. If a test fails and breaches this threshold then it’s time to analyse the test itself. The team can get together and discuss the reasons for failure. After this reason has been identified the team can decide how to act.
The discussions on these failing tests can lead to a refactor of the test code itself, thus improving code quality. It can also lead to a refactor of the functional code to allow for increased testability or a change to the way that test data is generated or stored. Each of these examples helps to improve the team’s process and provides a platform for producing high quality software.
In Summary
Test automation should be used to provide fast feedback to the team as to whether any problems have been introduced by the code they have produced. They can also help indicate any potential improvements in the entire team’s process. However, this is only possible if we track sensible metrics and act on them.
In order to decide which metrics you should measure within your team, you can use a checklist to help decide whether the metric is useful and what actions you would expect to see based on this metric. As mentioned at the beginning of this article, metrics should not be measured for the sake of producing metrics. They need to have a purpose. The checklist also helps to identify what threshold you and your team are comfortable with. Once the metric exceeds/falls below this threshold then you agree to act.
The Metric Decision Checklist is attached below:
The metrics that I’ve shared throughout this article are used to prompt further discussion across the whole team. Some (or all) of them can be presented on dashboards, but the numbers themselves should not be the end result.
The end result of these test automation metrics are the actions that are taken based on the data that is produced. The actions that the team takes help to improve the quality of software that is created in each sprint. And that is the value of generating and analysing these test automation metrics.