- Test Set Structure
- Time Management
- Test Sets & Runs Status and Data Representation
- Managing Test Sets
The Test Sets & Runs module is where you run the tests that were created in the Test Library. A Test Set is a group of tests that belong to specific tasks or features or have another reason to be run together.
A Test Set can contain all types of tests at once: automated, manual, BDD, and exploratory. This ability allows combining various tests and improves QA coverage and traceability.
Test Sets allow you to reuse tests as often as you need in order to make your process more efficient. You can organize tests in the same way that you organize your work into cycles or tasks.
Good candidates for Test Sets include:
- Tests that focus on a certain part of the system, such as GUI or Database
- Tests that belong to a certain task, such as Regression or Sanity
- A set of tests that need to be run by a single tester during a day or calendar week
To understand the relationship between Tests, Test Sets, Test Instances and Runs, Please read the PractiTest Methodology article.
Test Set Structure
Test Sets are divided into 5 tabs: General, Instances, Attachments, Comments, and History.
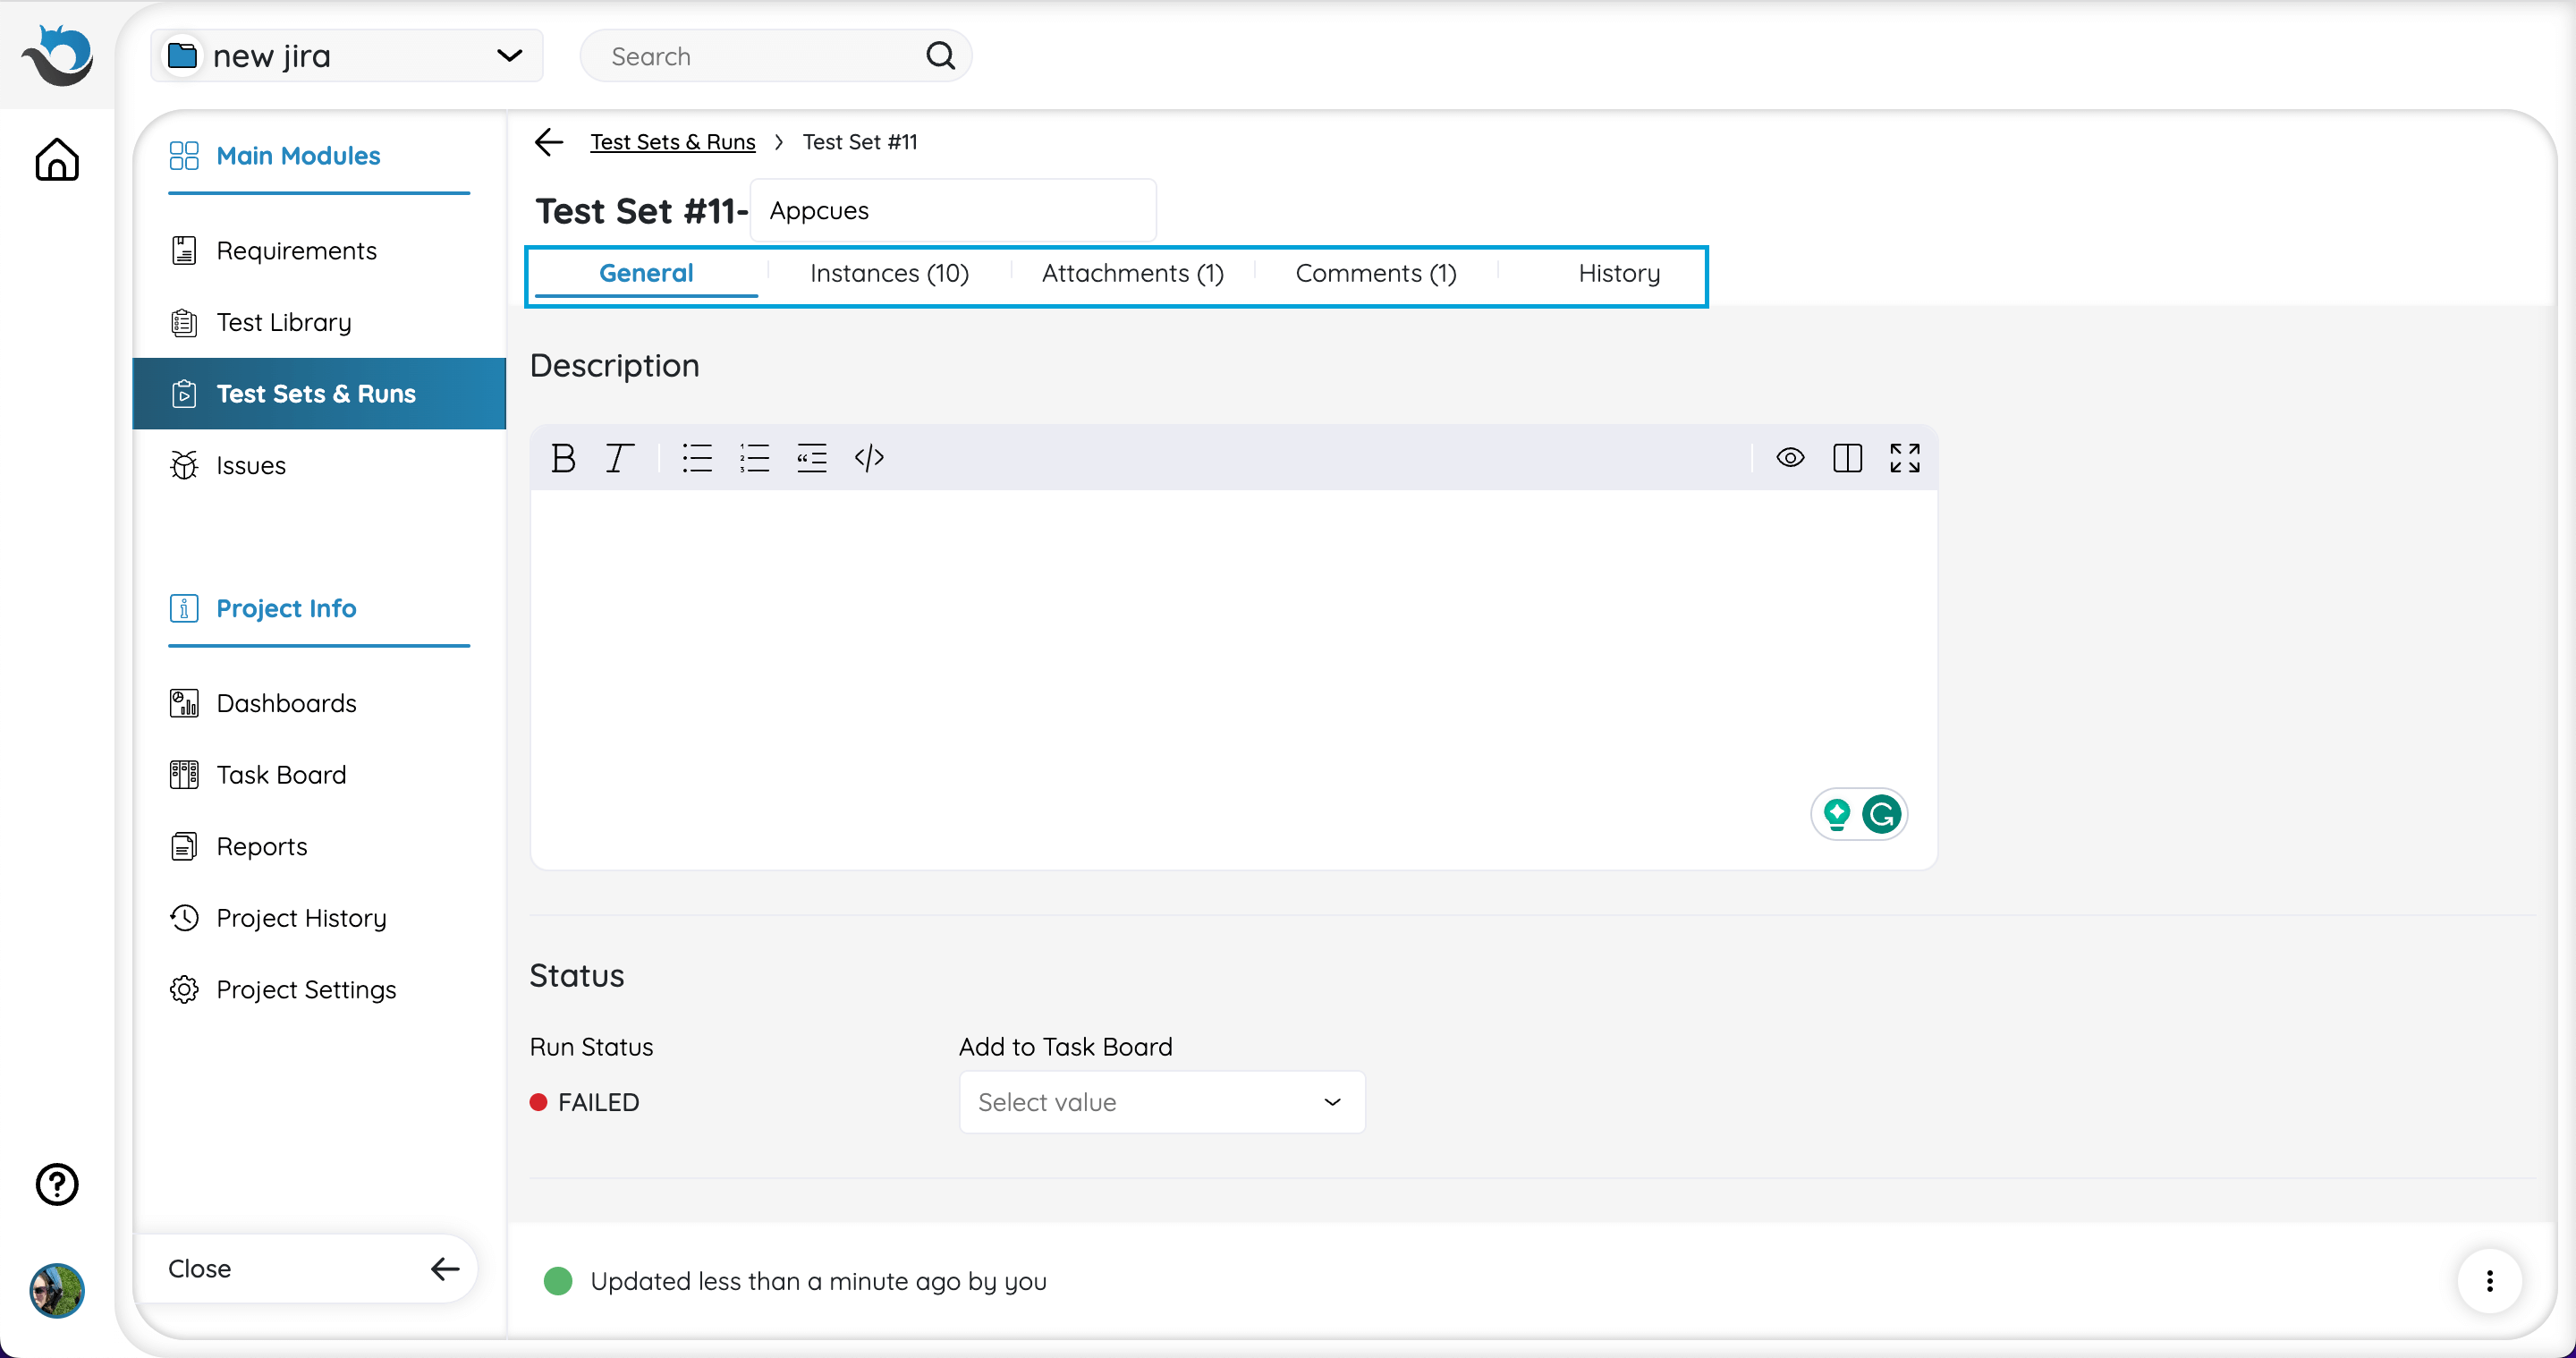
At the bottom of the Test Set screen, you can find the actions bar.
When creating a Test Set, select ‘Create’ to save your Test Set.
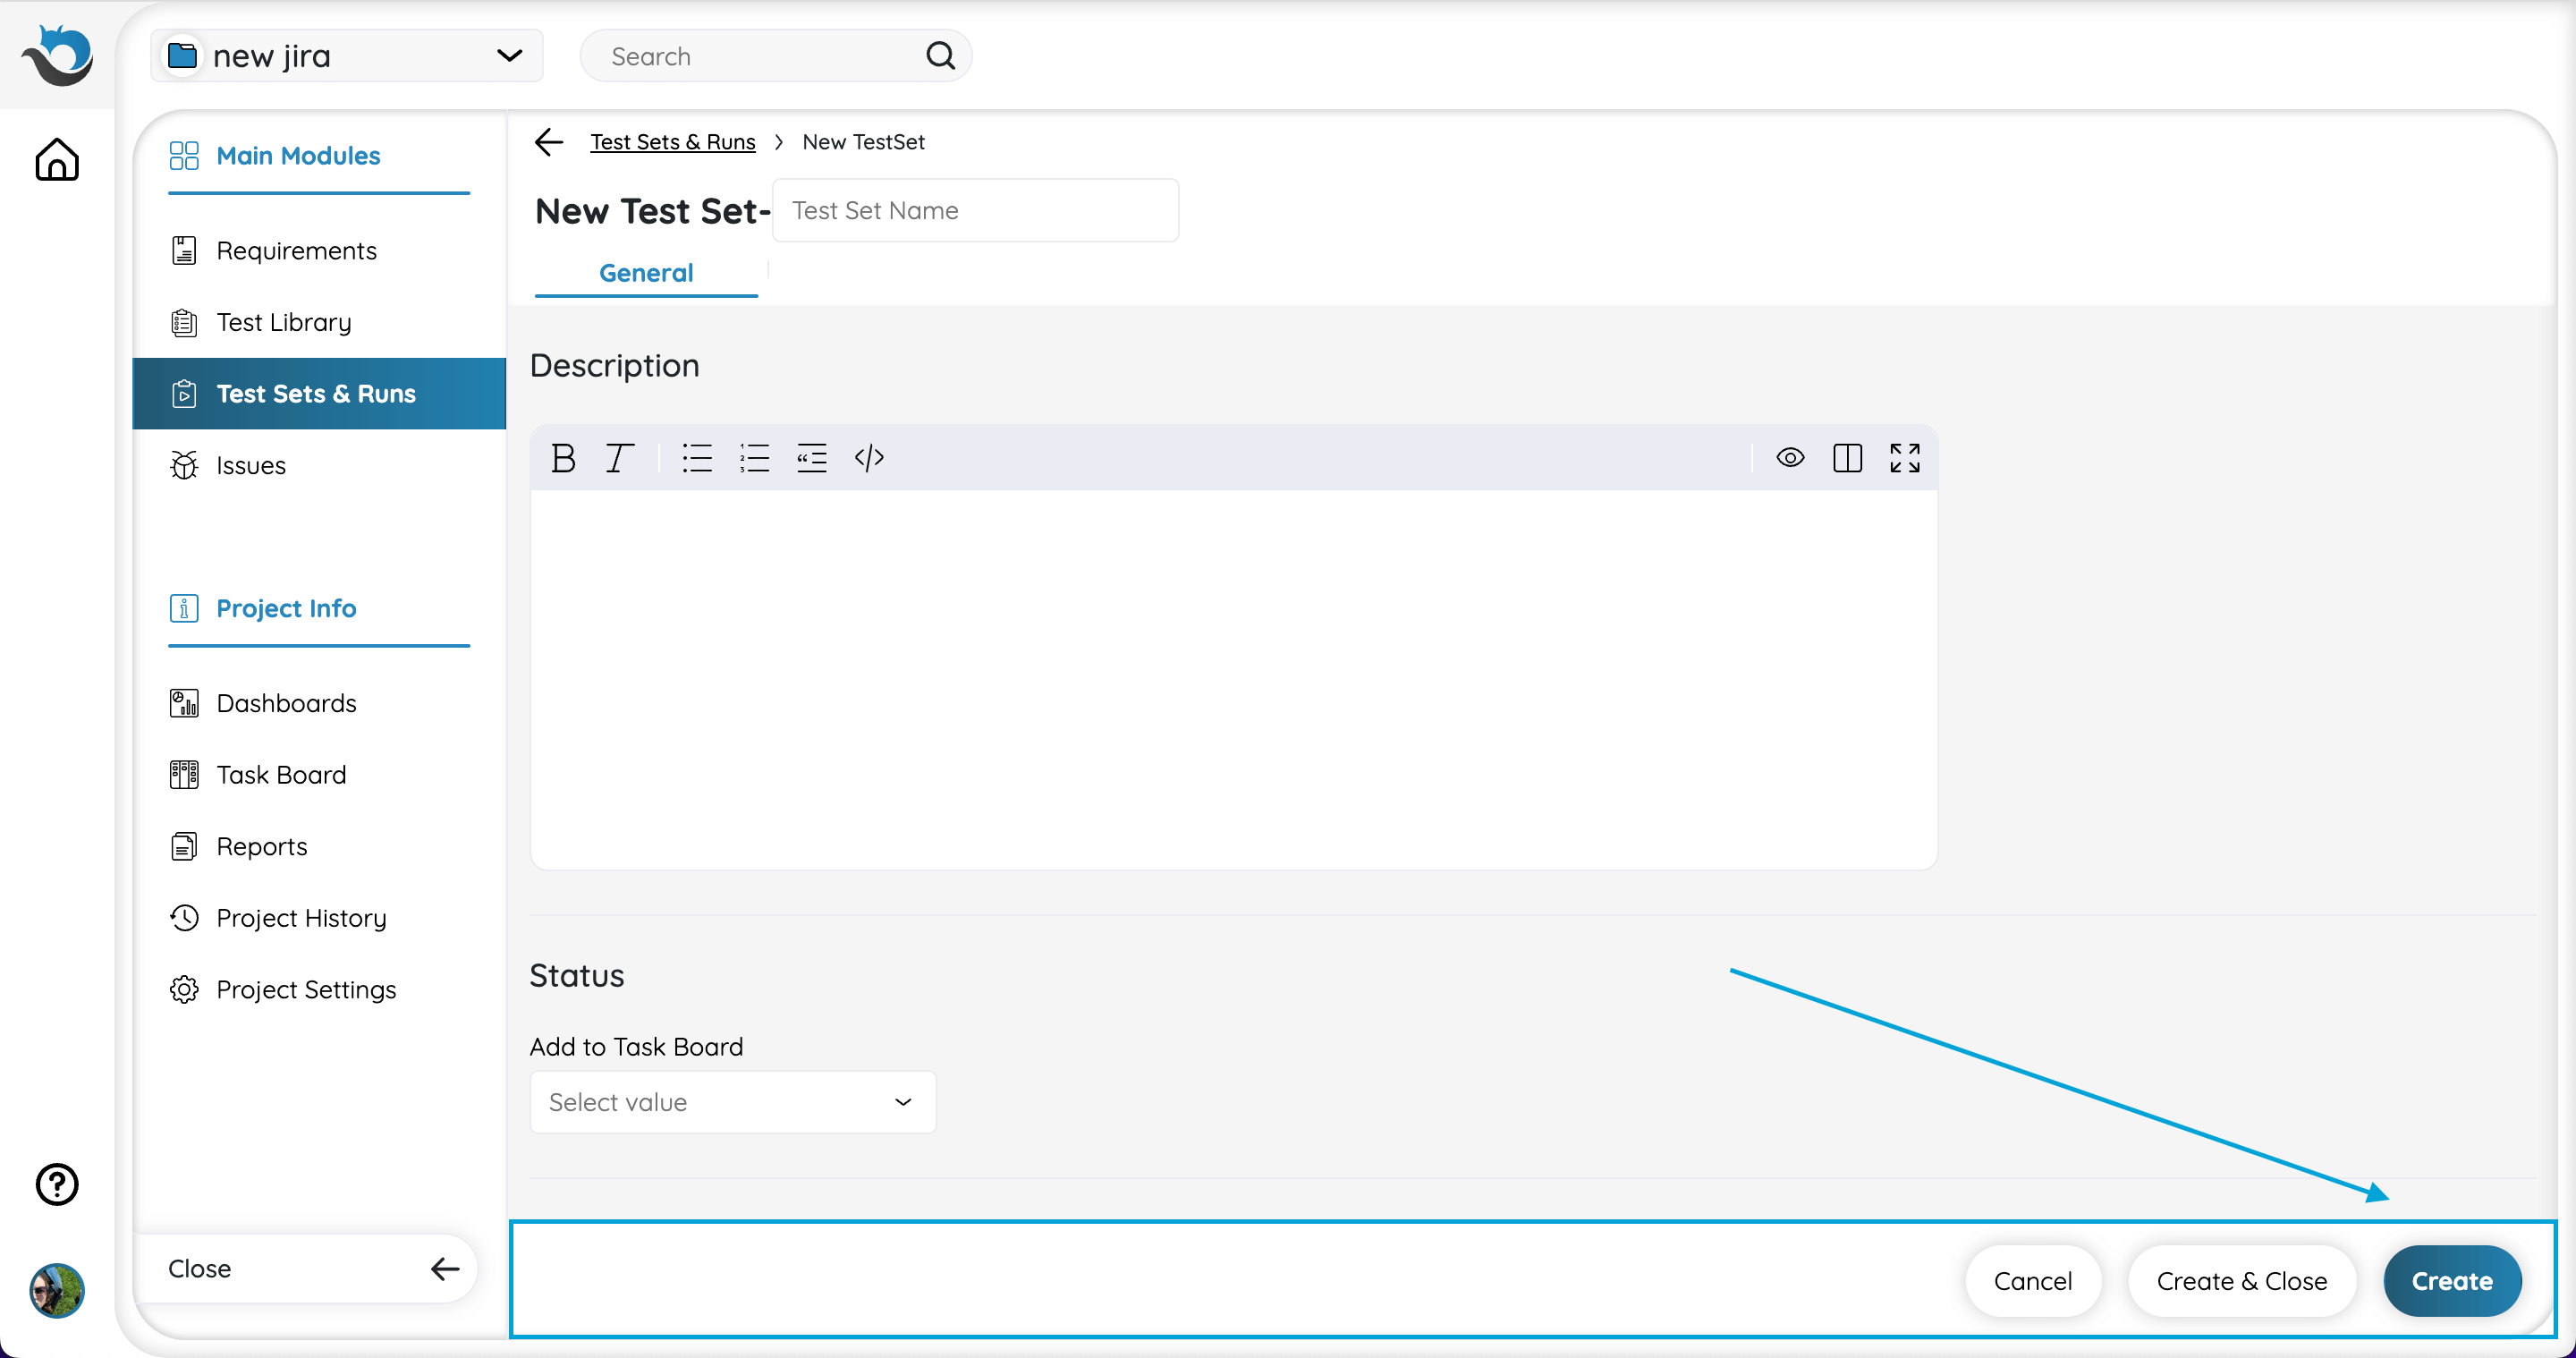
Note: When creating a new Test Set, the tabs will only appear after clicking ‘Create’.
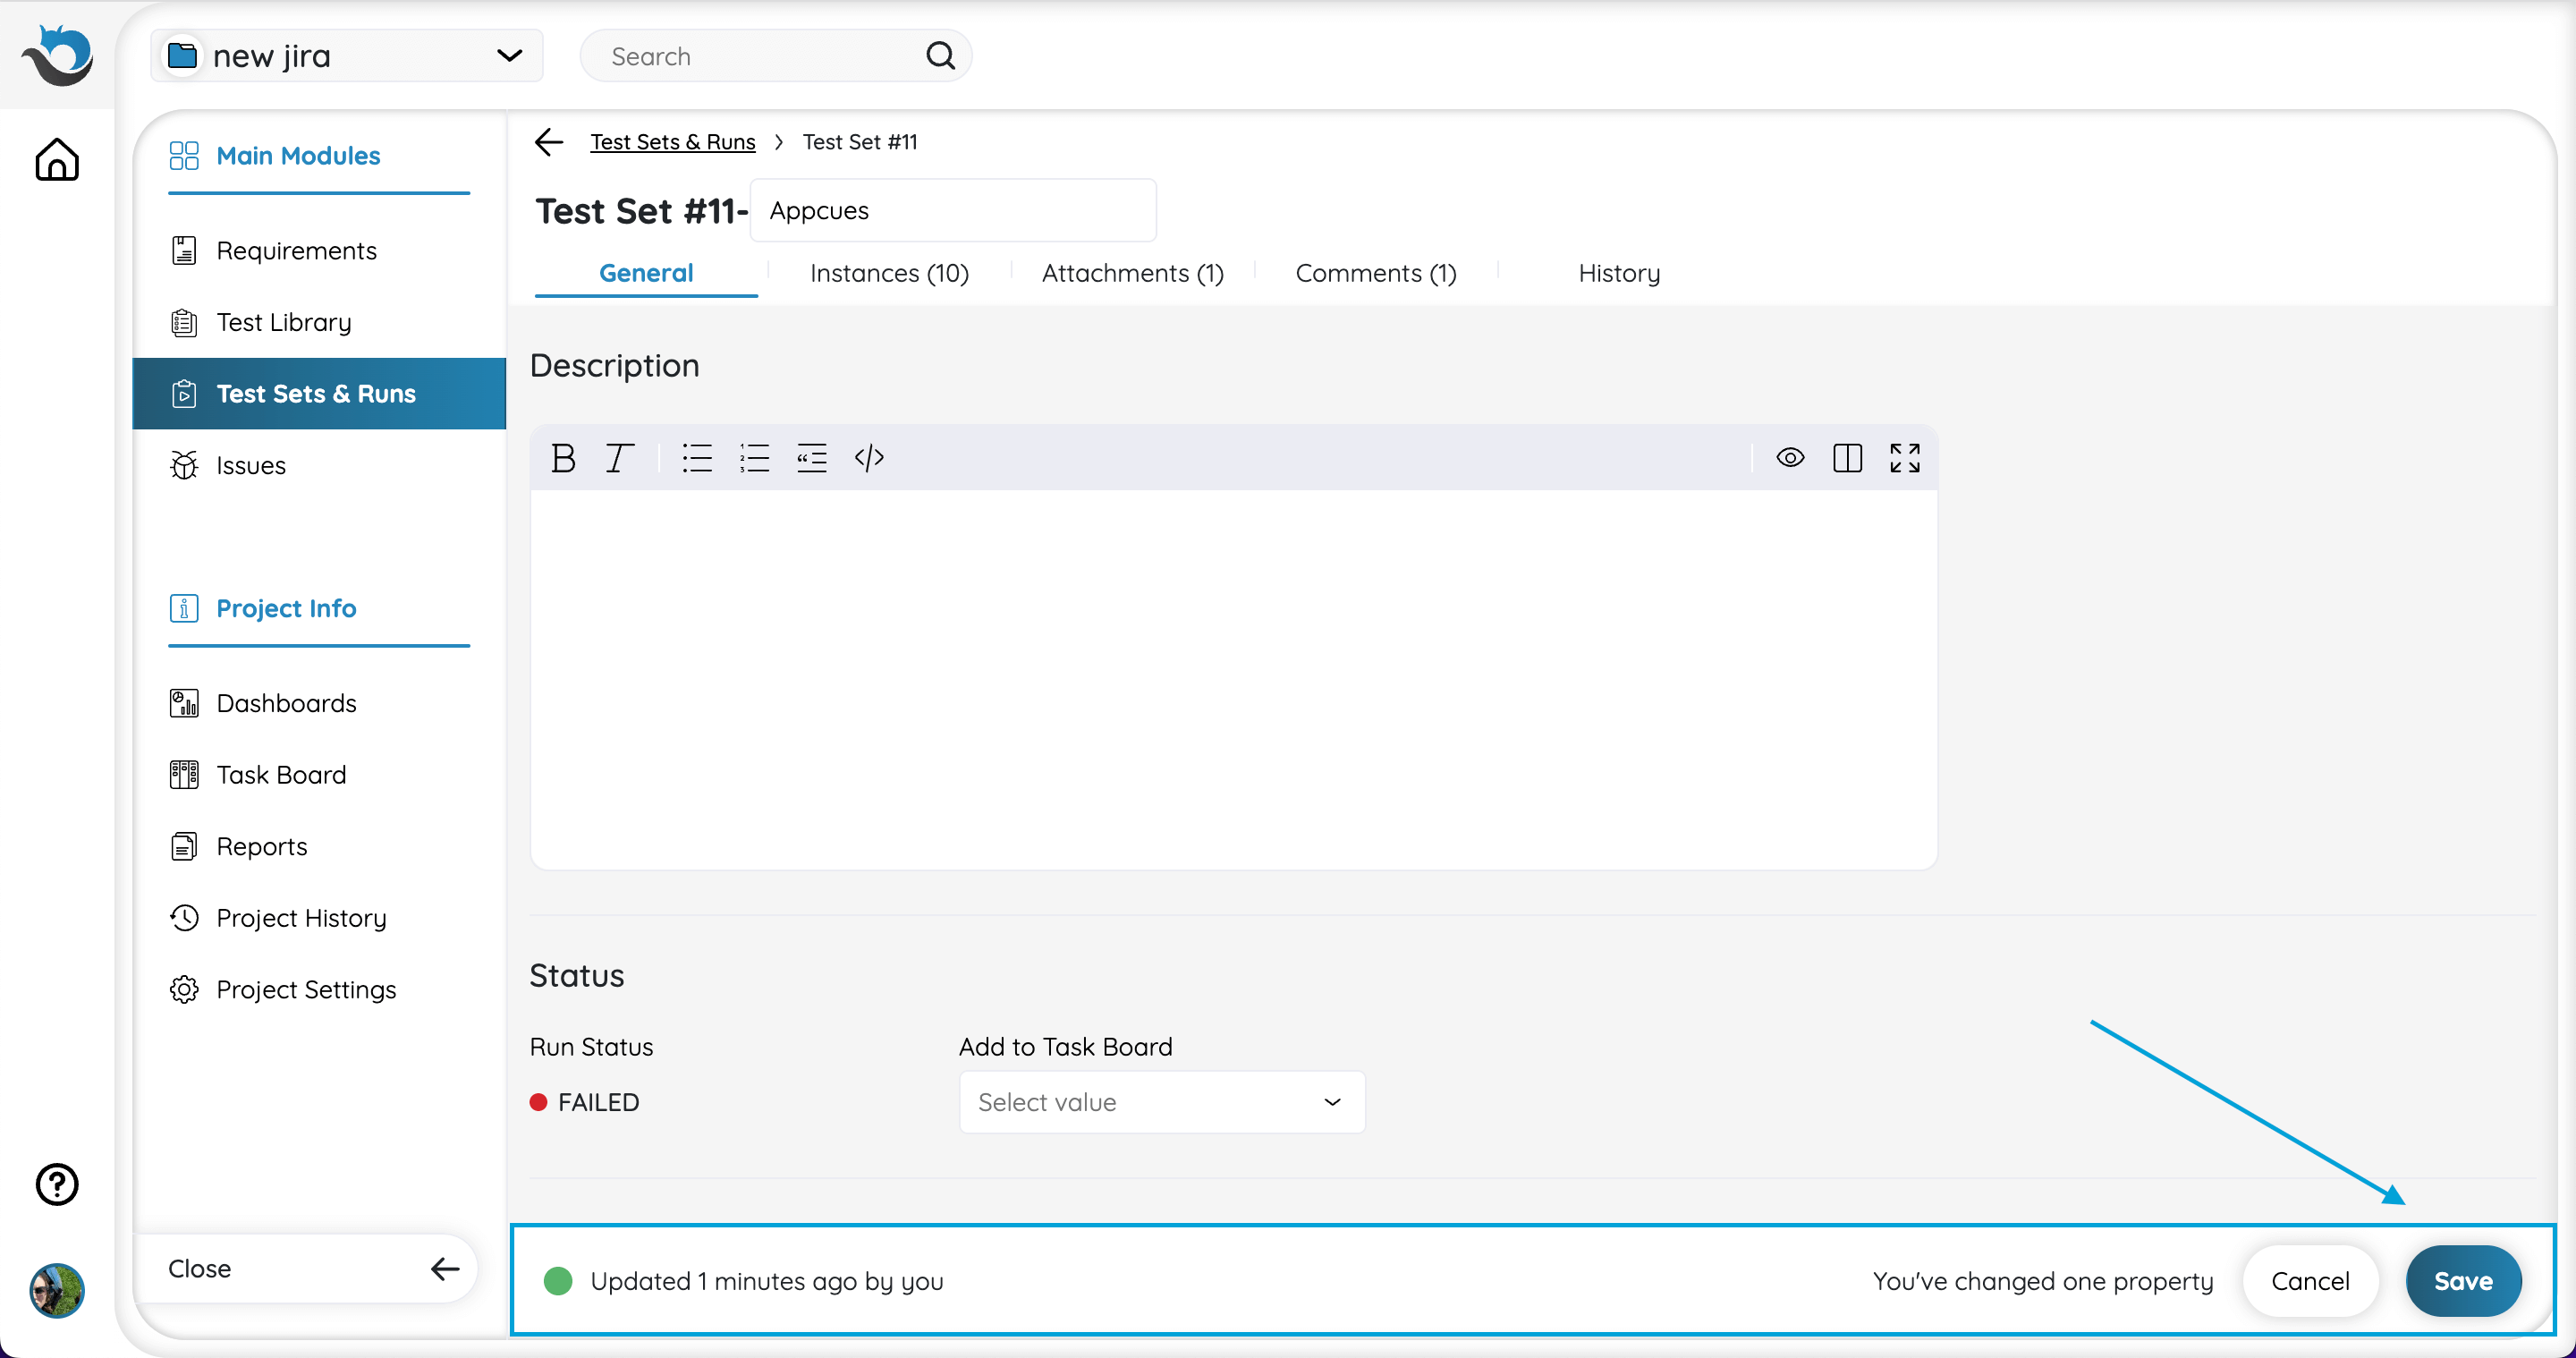
Once changes have been made to your Test Set, click ‘Save’ to save changes or ignore them.
You can also perform other actions, such as cloning the Test Set, by clicking on the three-dot on the lower right side of the bar.
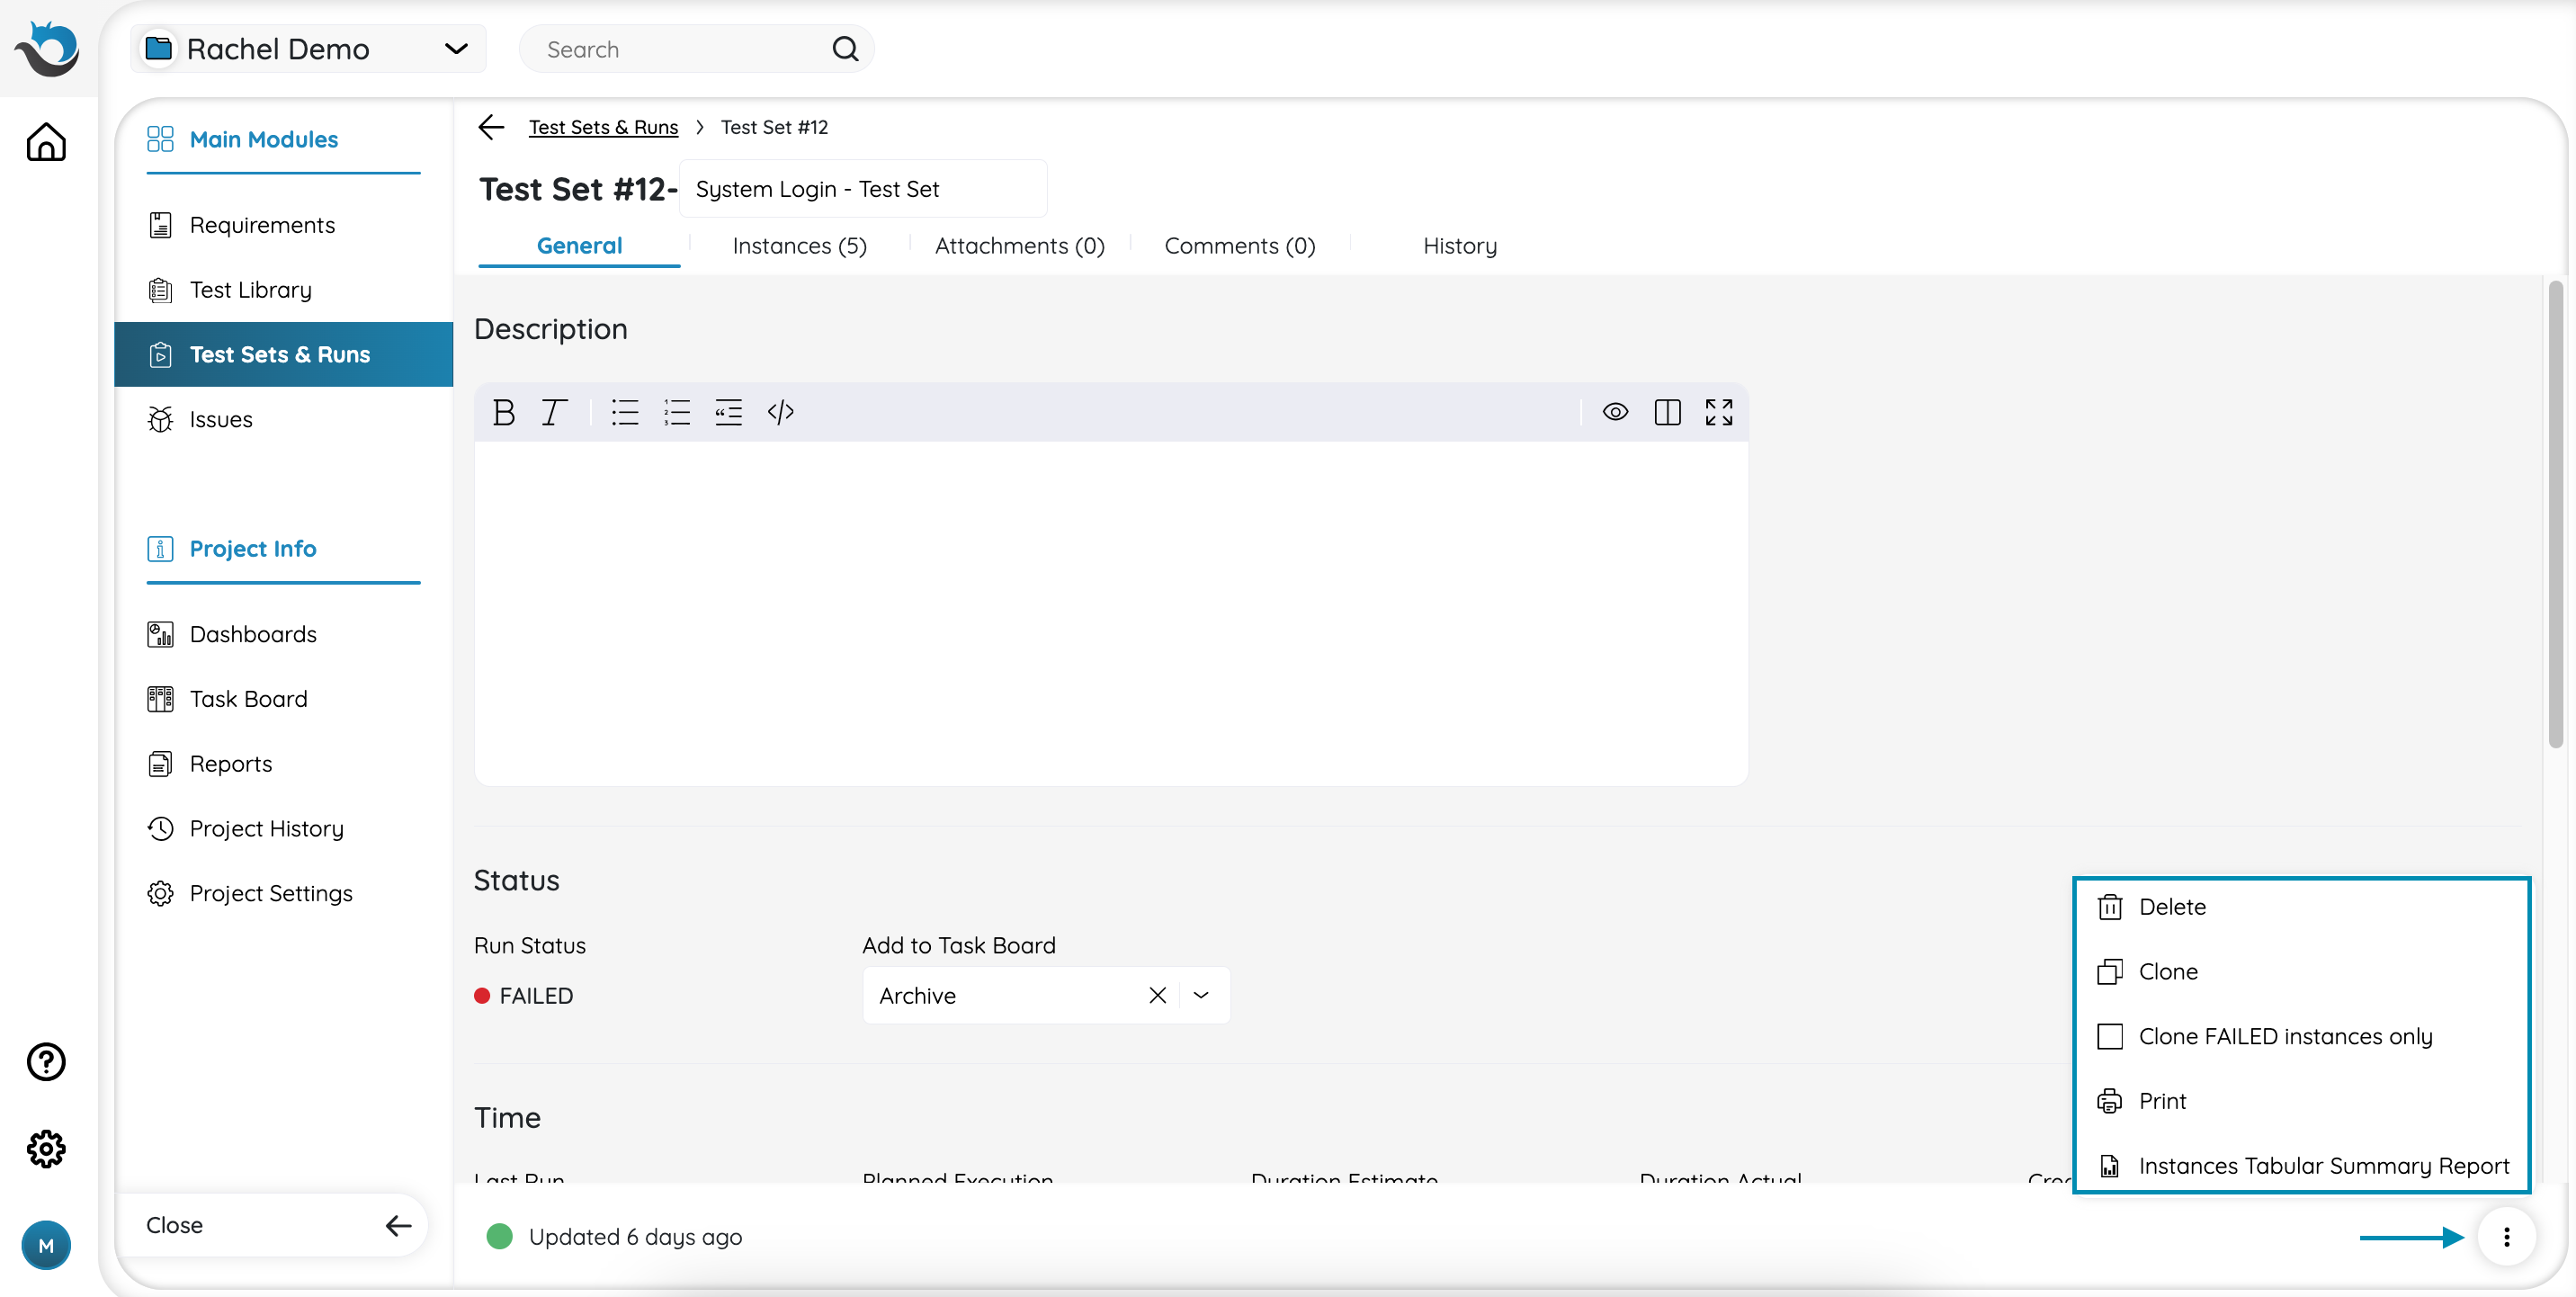
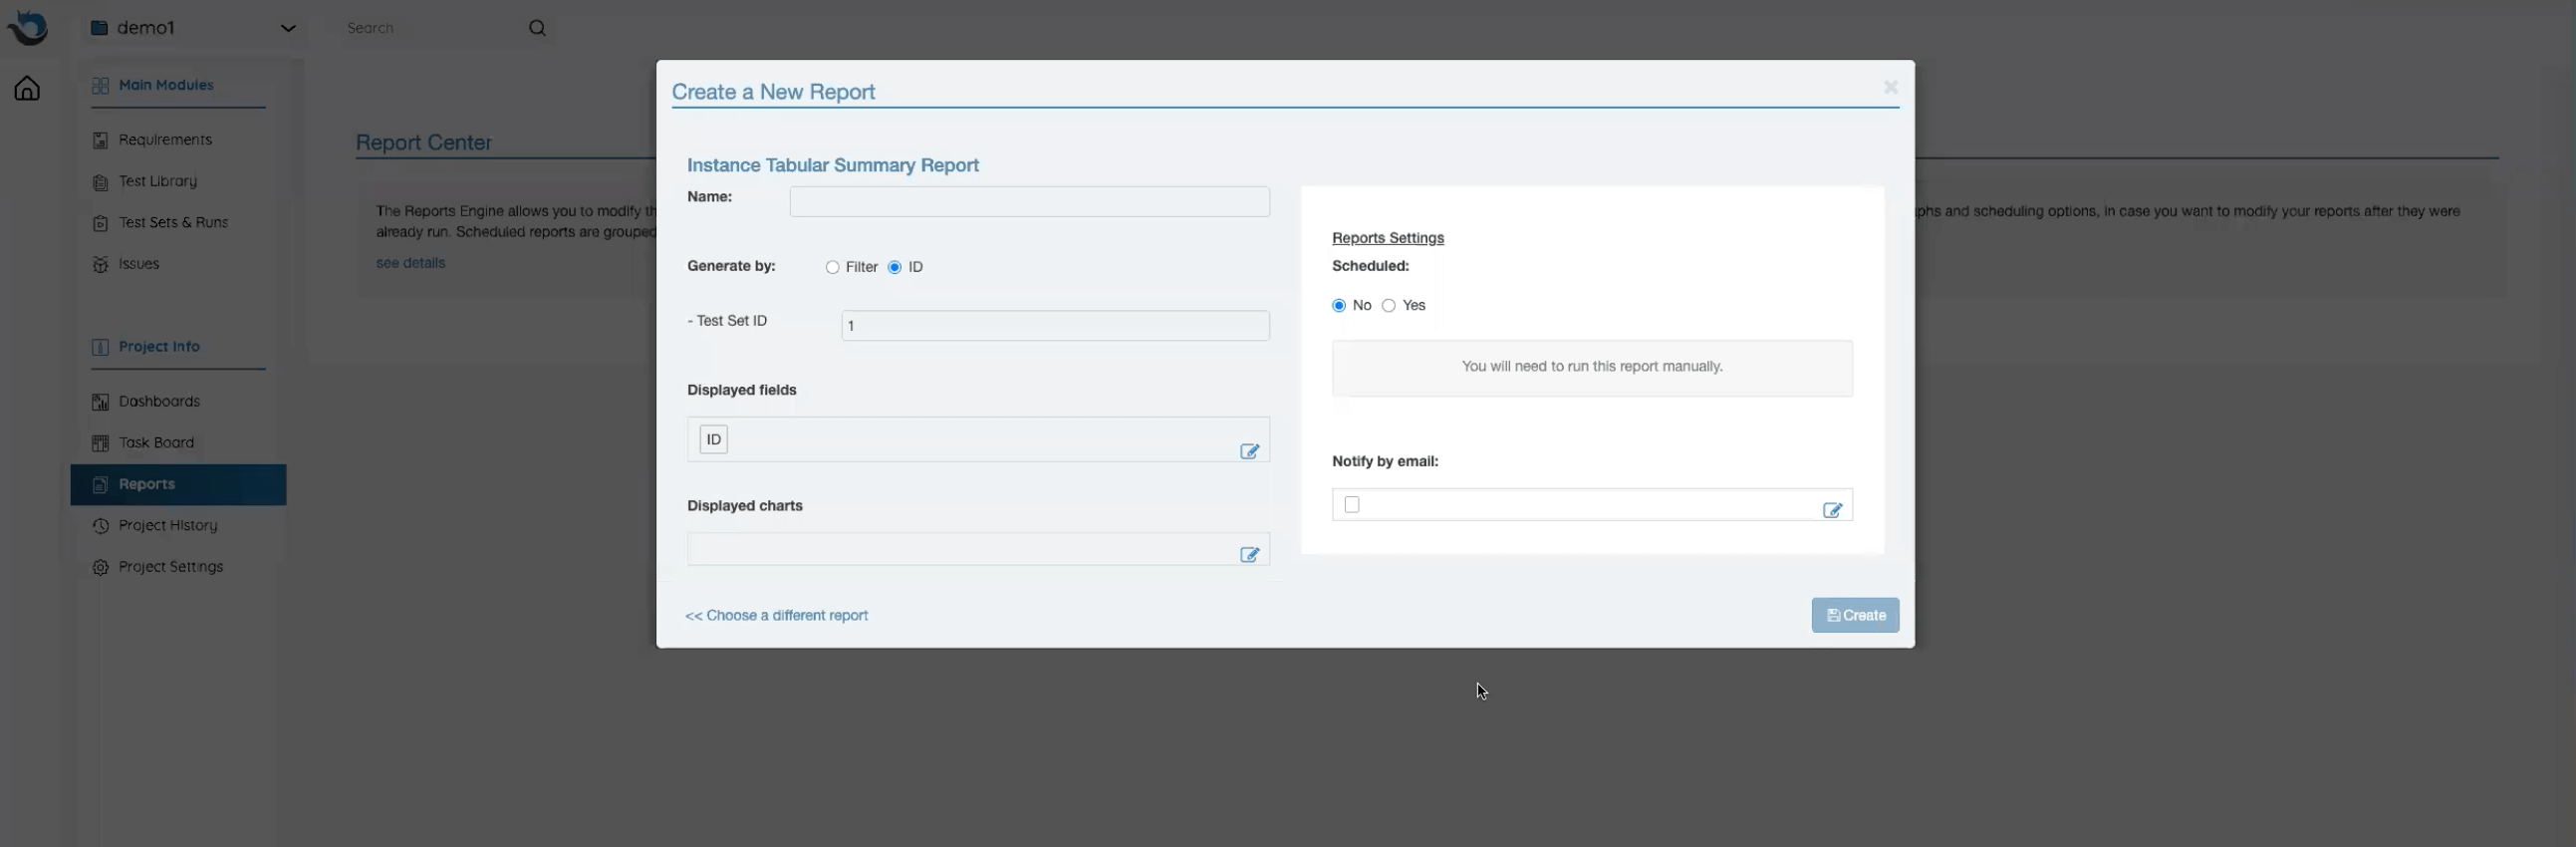
From the actions bar, you have the option to create an Instance Tabular Summary Report for this specific Test Set. If you choose the “Instance Tabular Summary Report” option, a new tab will open. This tab is the Create window of The Instance Tabular Summary Report, with the ID of this Test Set pre-populated. You can edit and export the report as explained here.
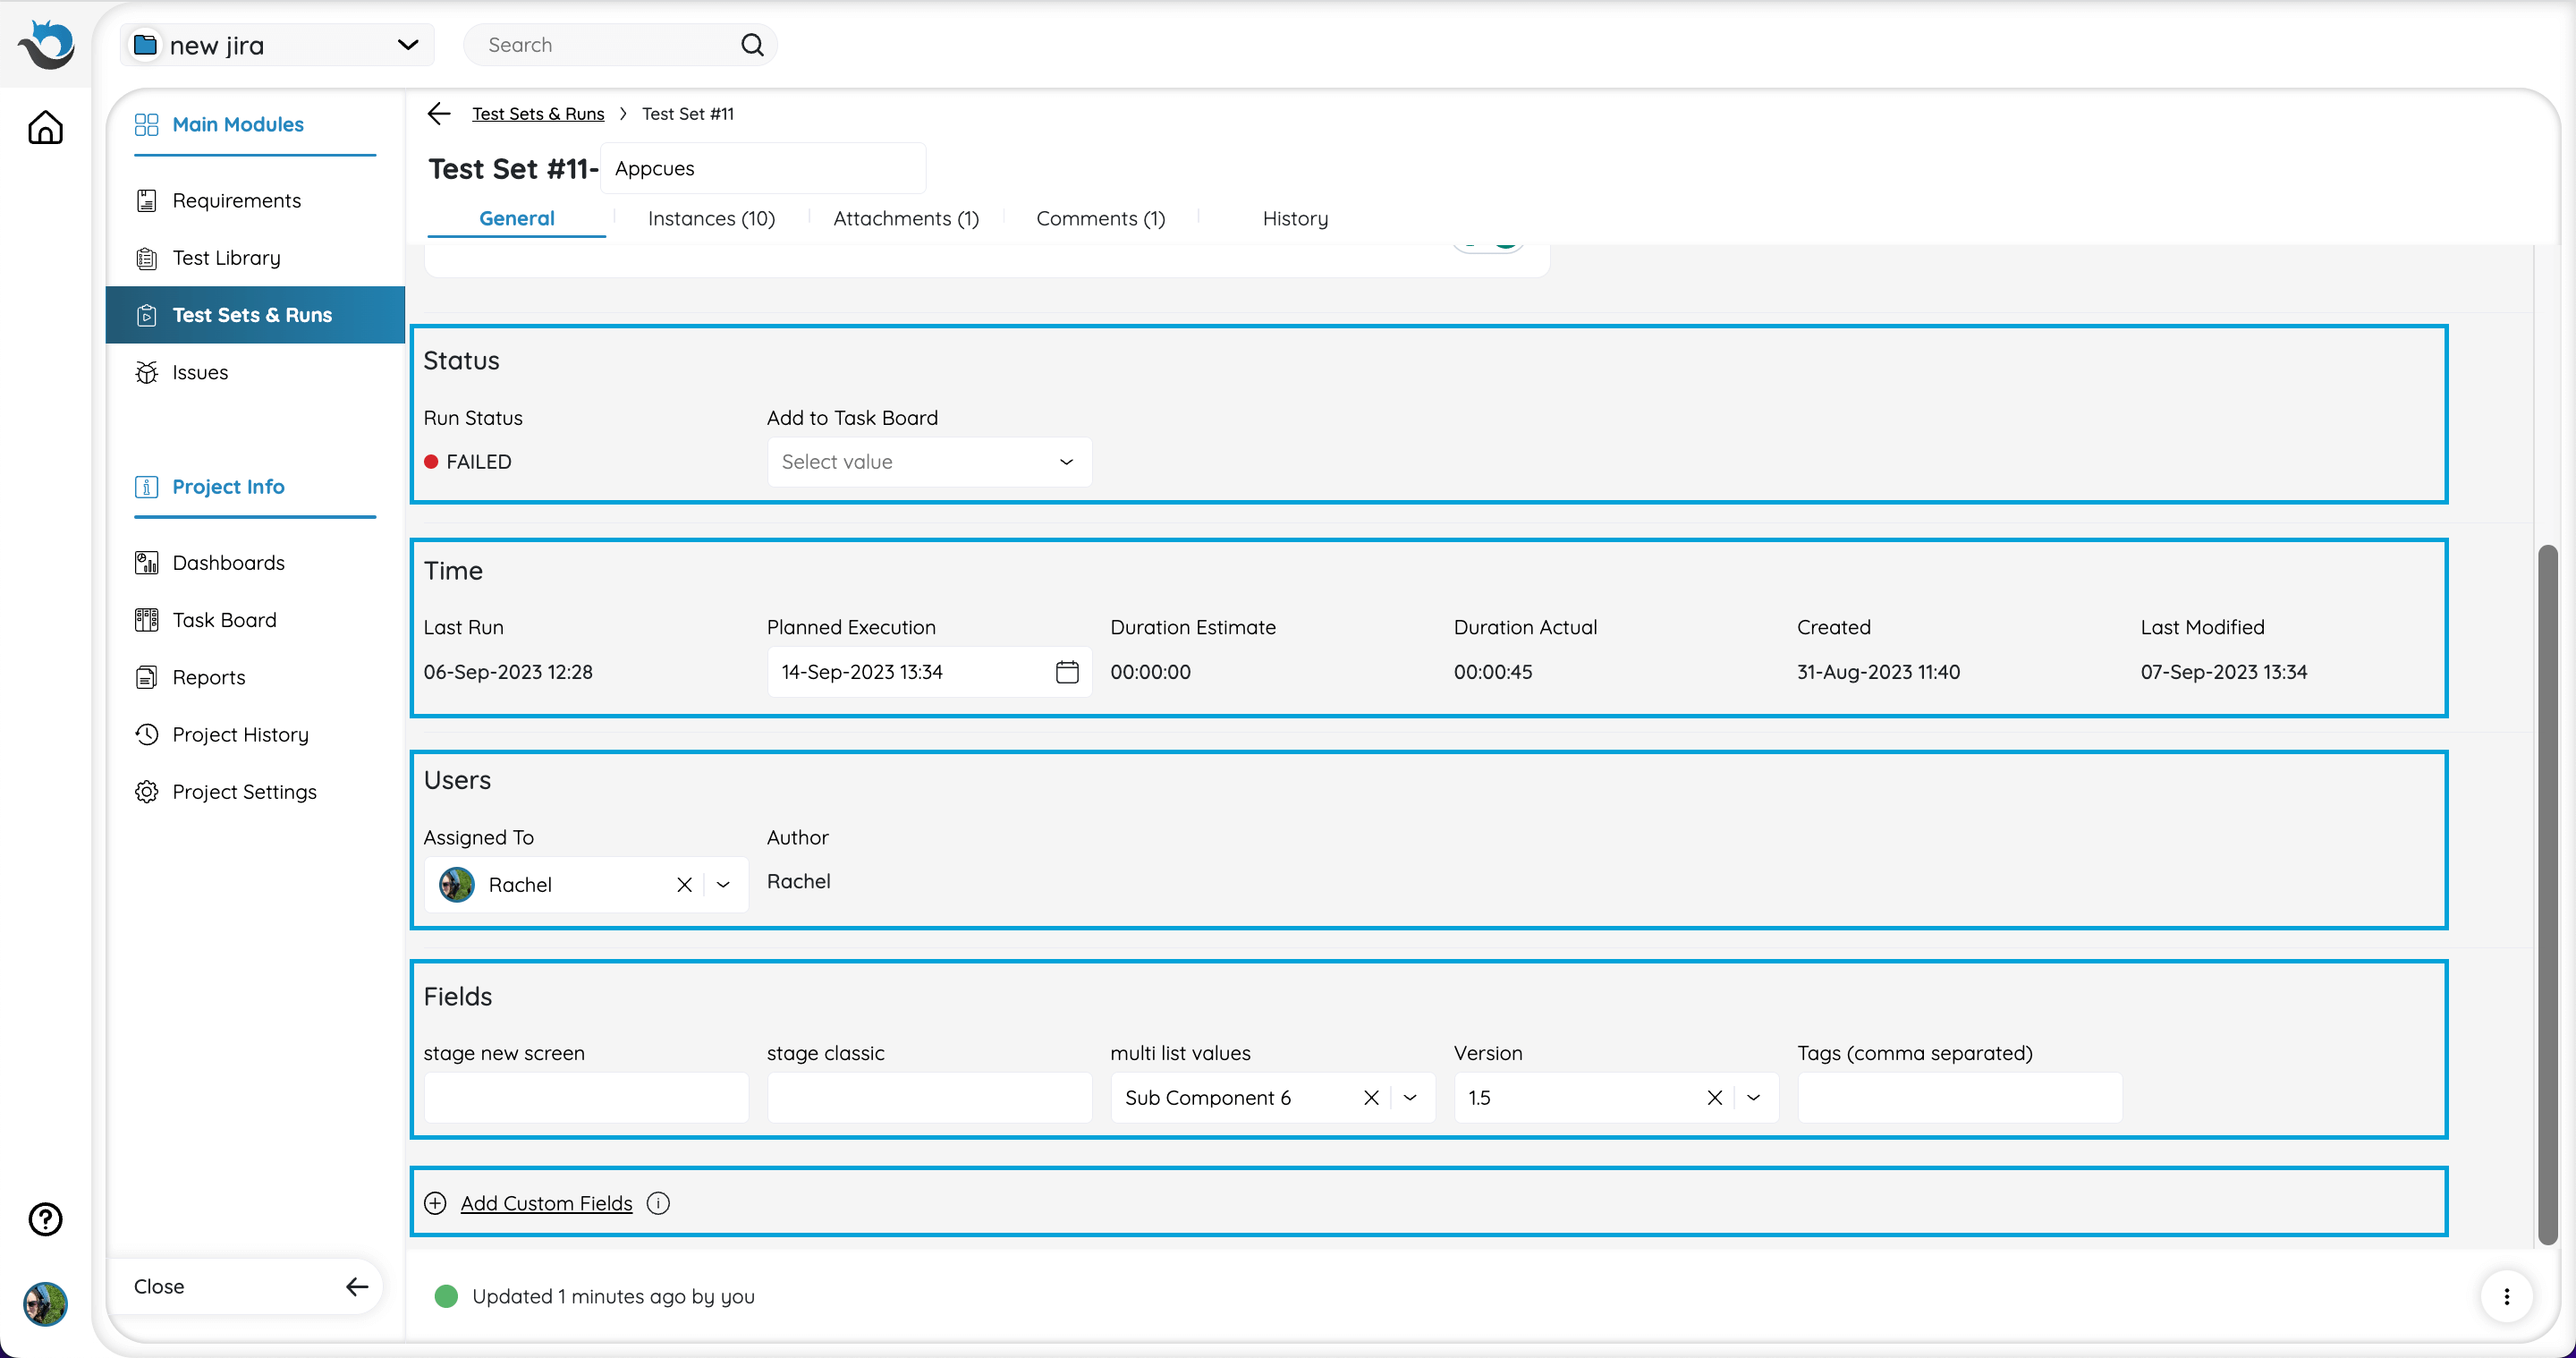
General
In the General tab, you can add values to the Test Set fields.
Fields are organized by their type - Status, Time, Users, and Fields for custom fields.
At the bottom of the tab, there is a direct link to create a new custom field.
Instances
The Instances tab is where you add the tests you want to run in this Test Set and can manage and view the Test Instances information.
A Test Instance is a dynamic duplicate of your test, which allows you to reuse the tests that were created in the Test Library. Instances allow you to reuse tests by assigning and running them under multiple Test Sets (or even multiple times to the same Test Set).
Read more about the relationship between Tests, Test Sets, Test Instances, and Runs here.
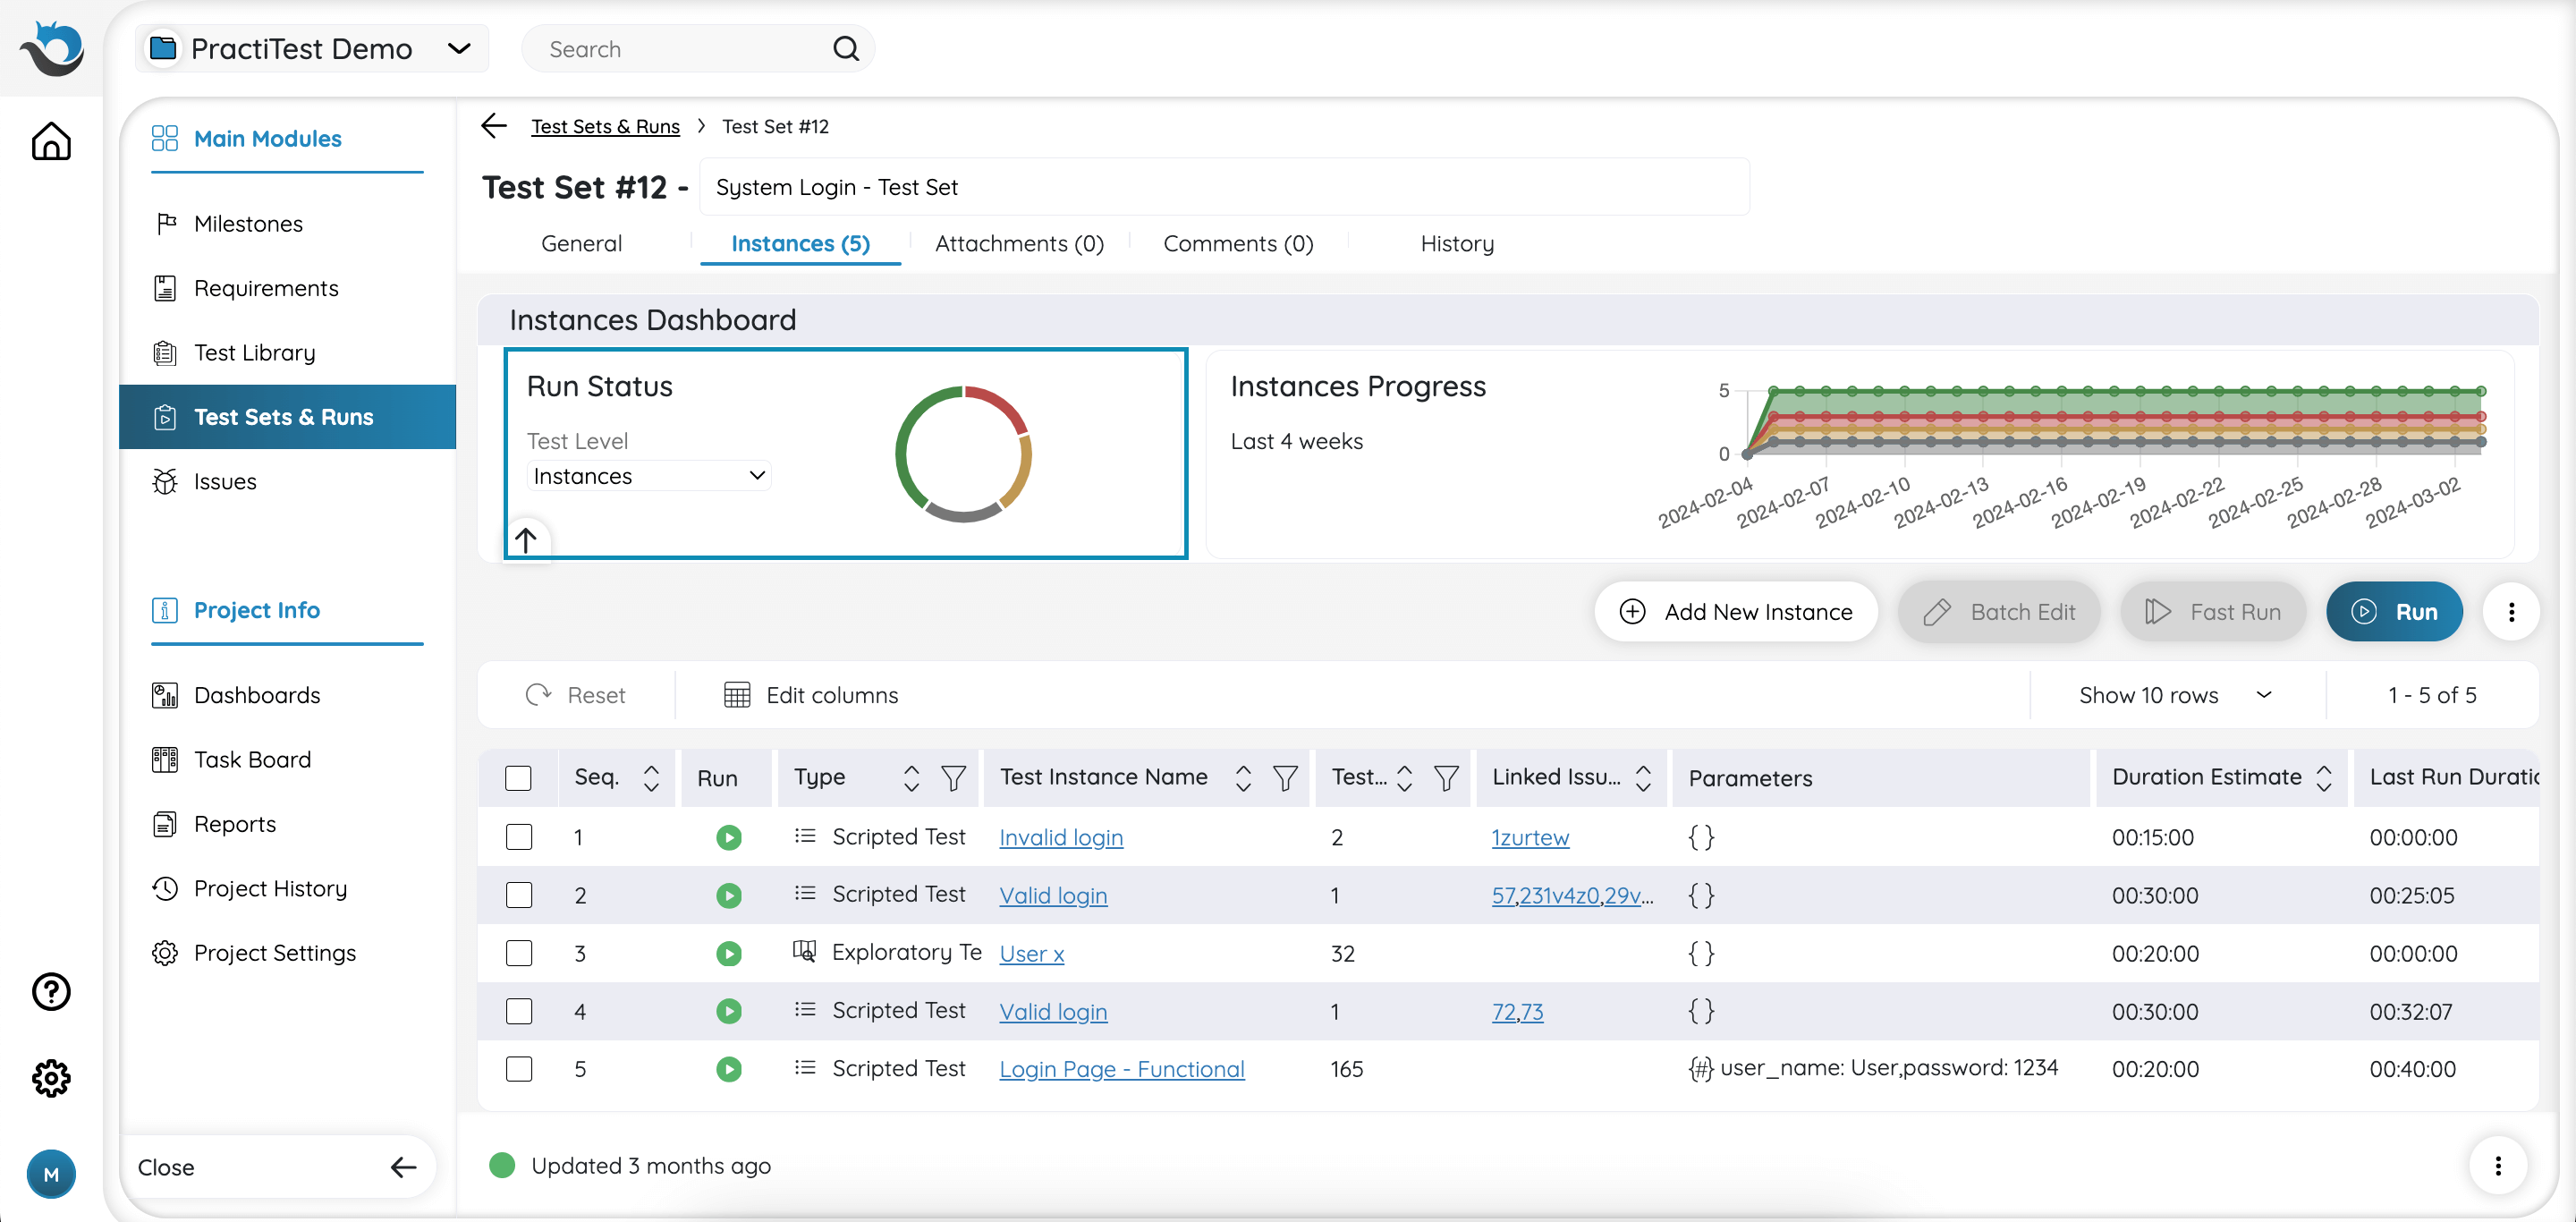
The Instance Dashboard
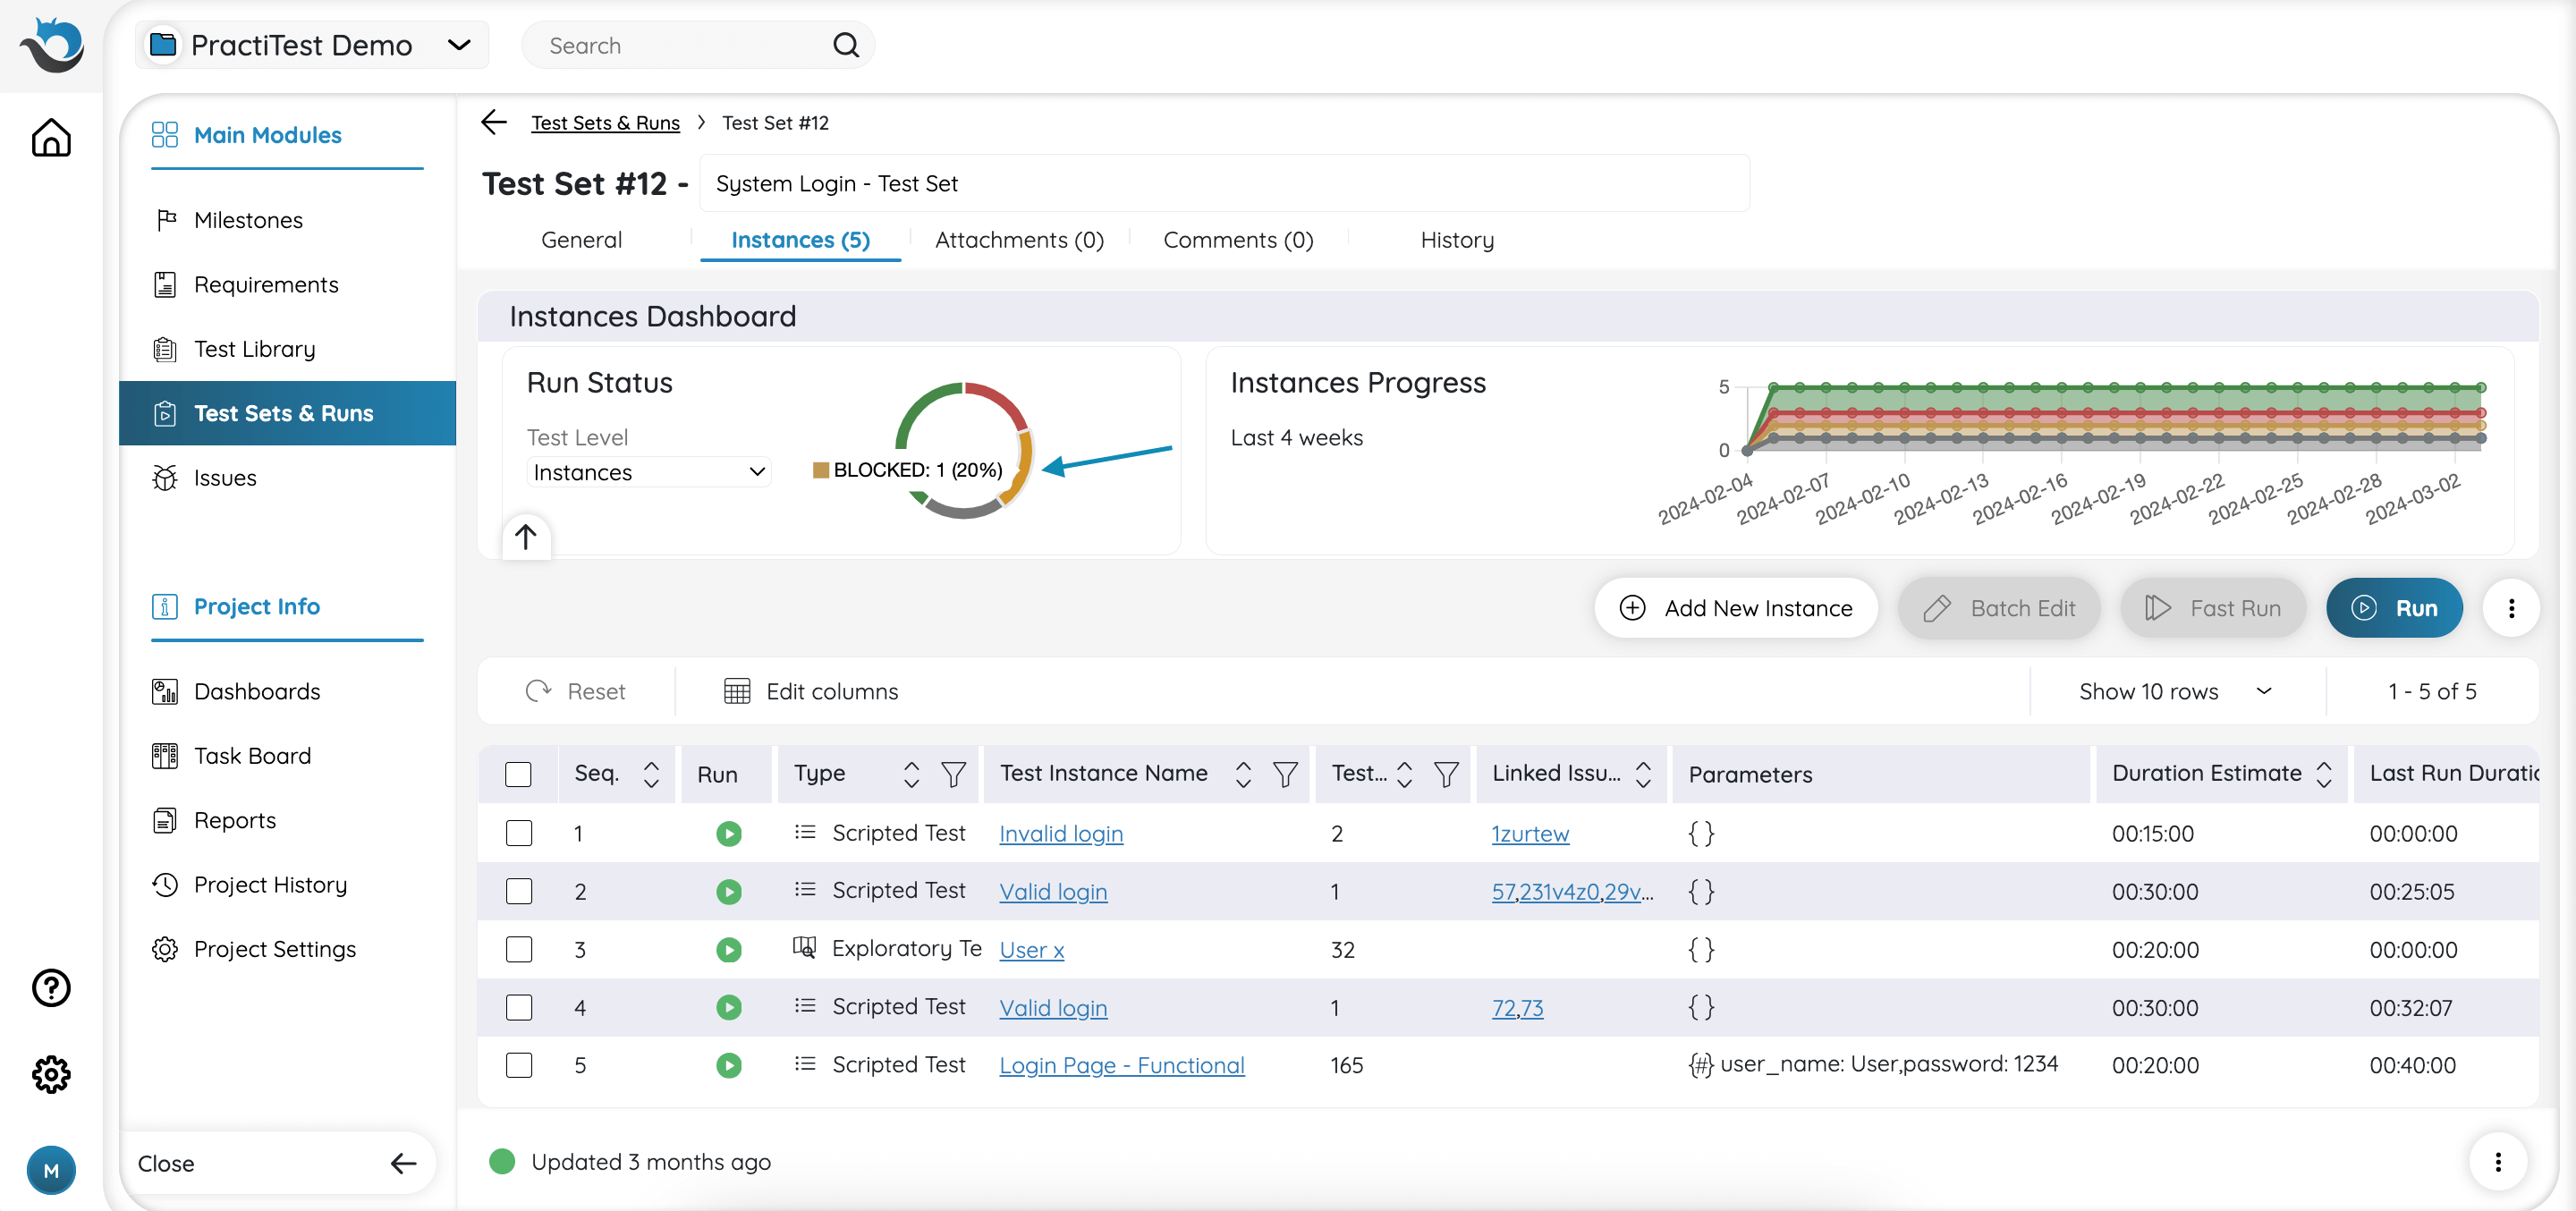
At the top of the Instance tab you will find a mini-dashboard. In this dashboard, you can find a pie chart showing the percentage of test instances that have passed, failed, blocked, etc.
The same information is shown in the Steps level as an aggregation of all the steps in the Test Instances last run of your Test Set. To view these details, choose ‘Steps’ in the Test Level dropdown.
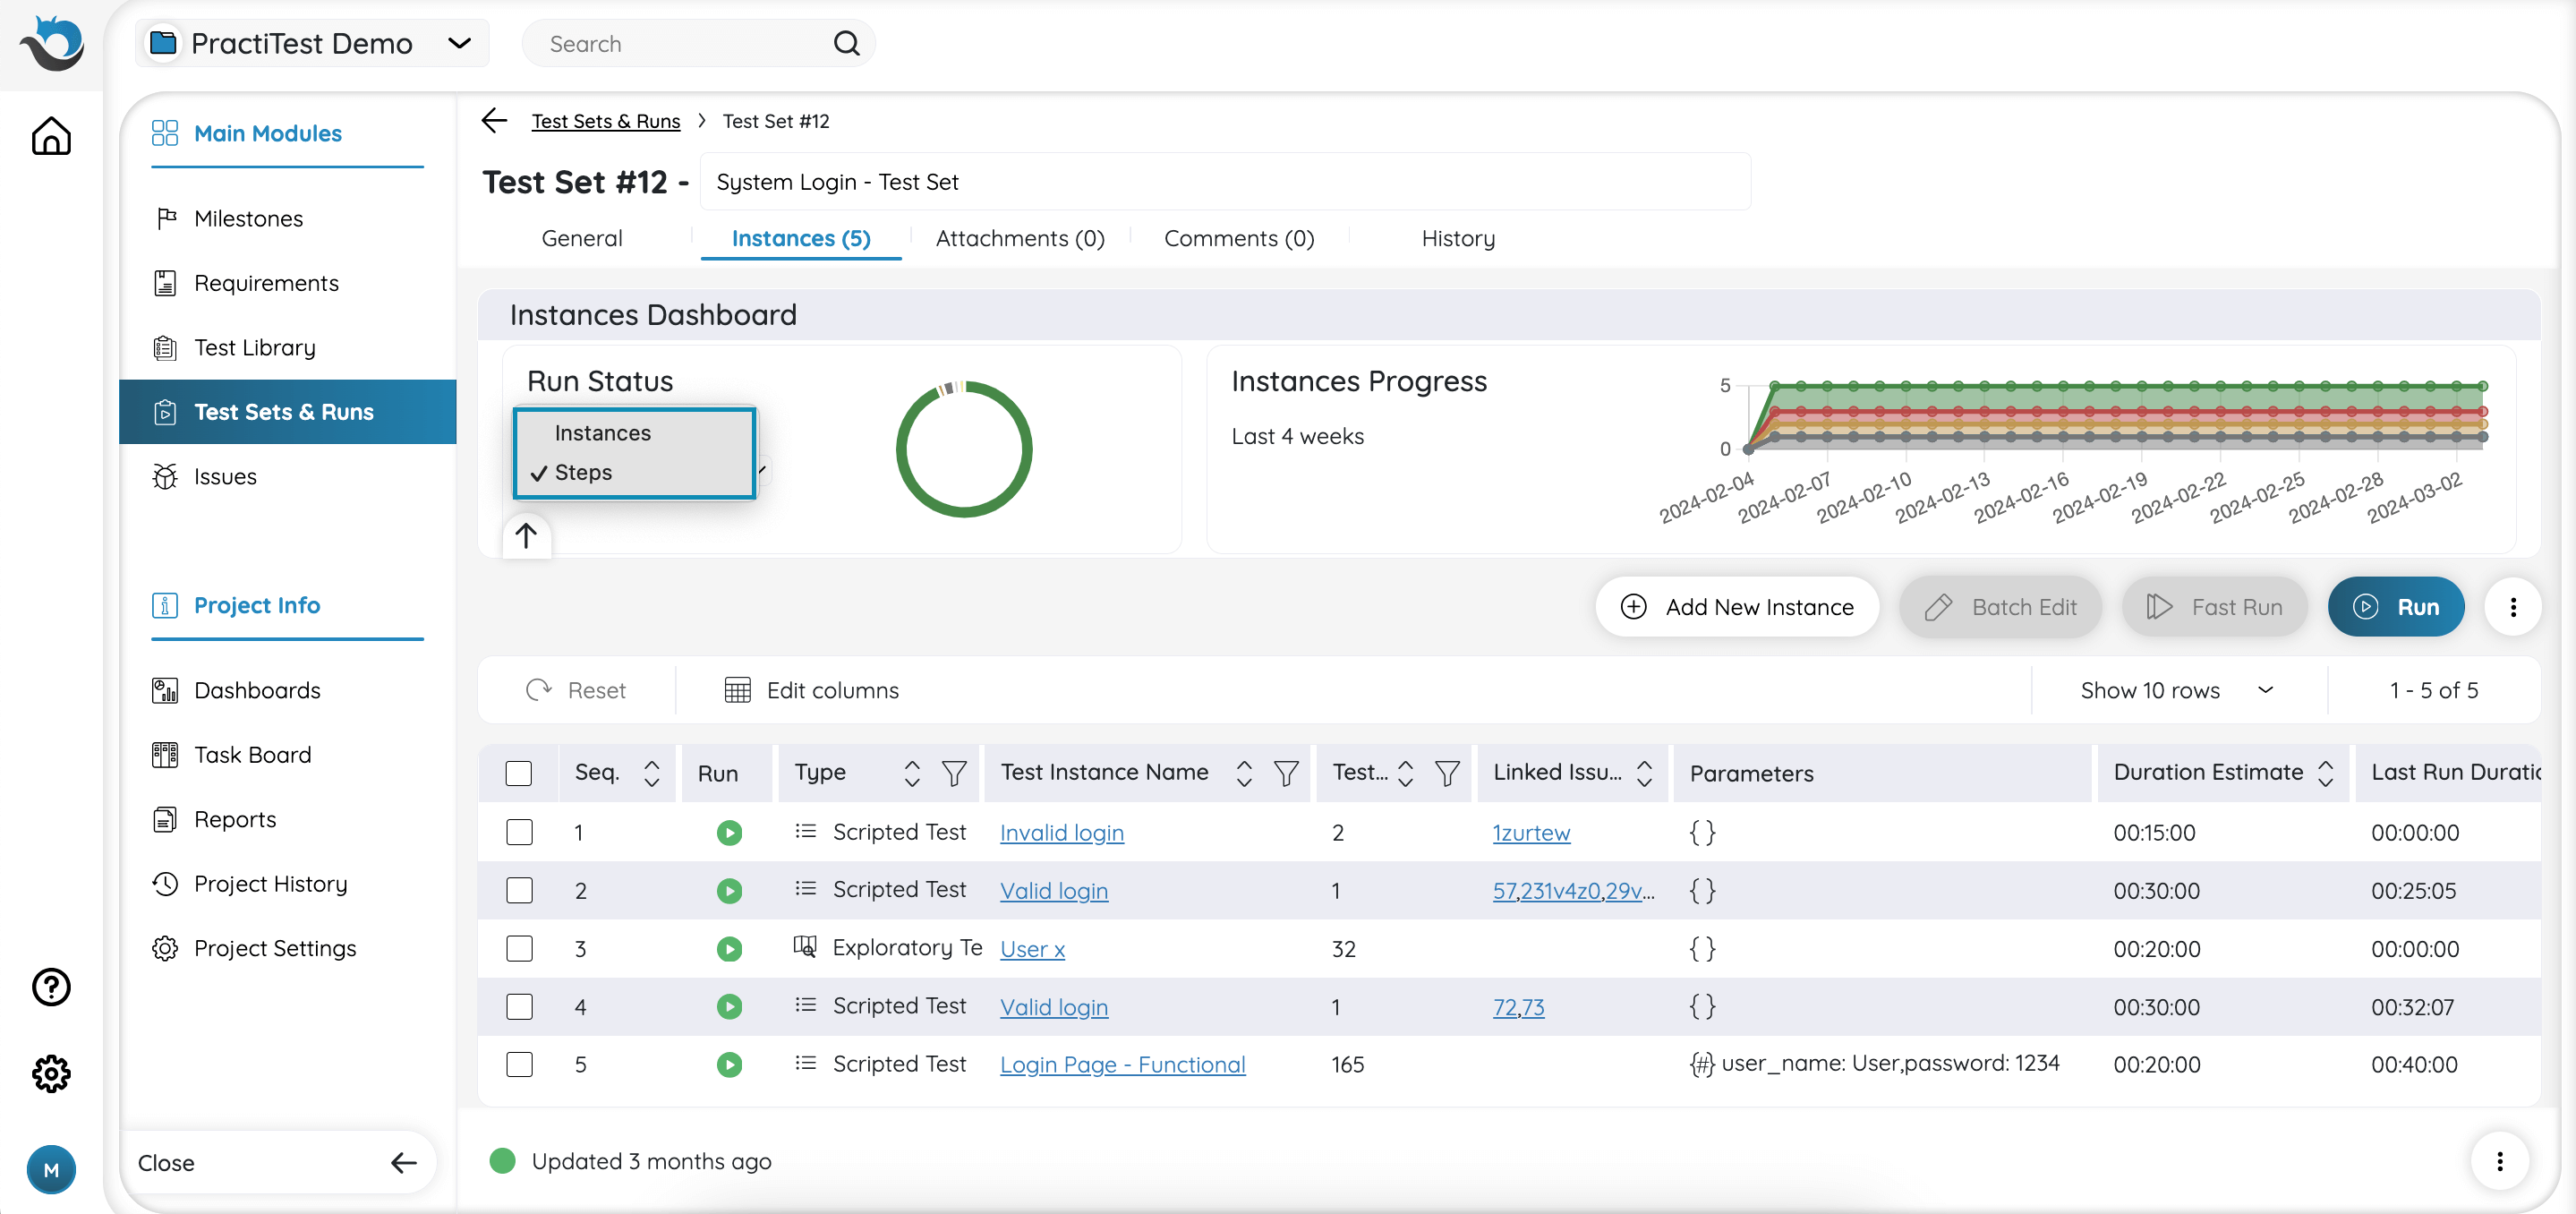
When hovering the statuses in the pie chart, you will see the instances/steps count of each status.
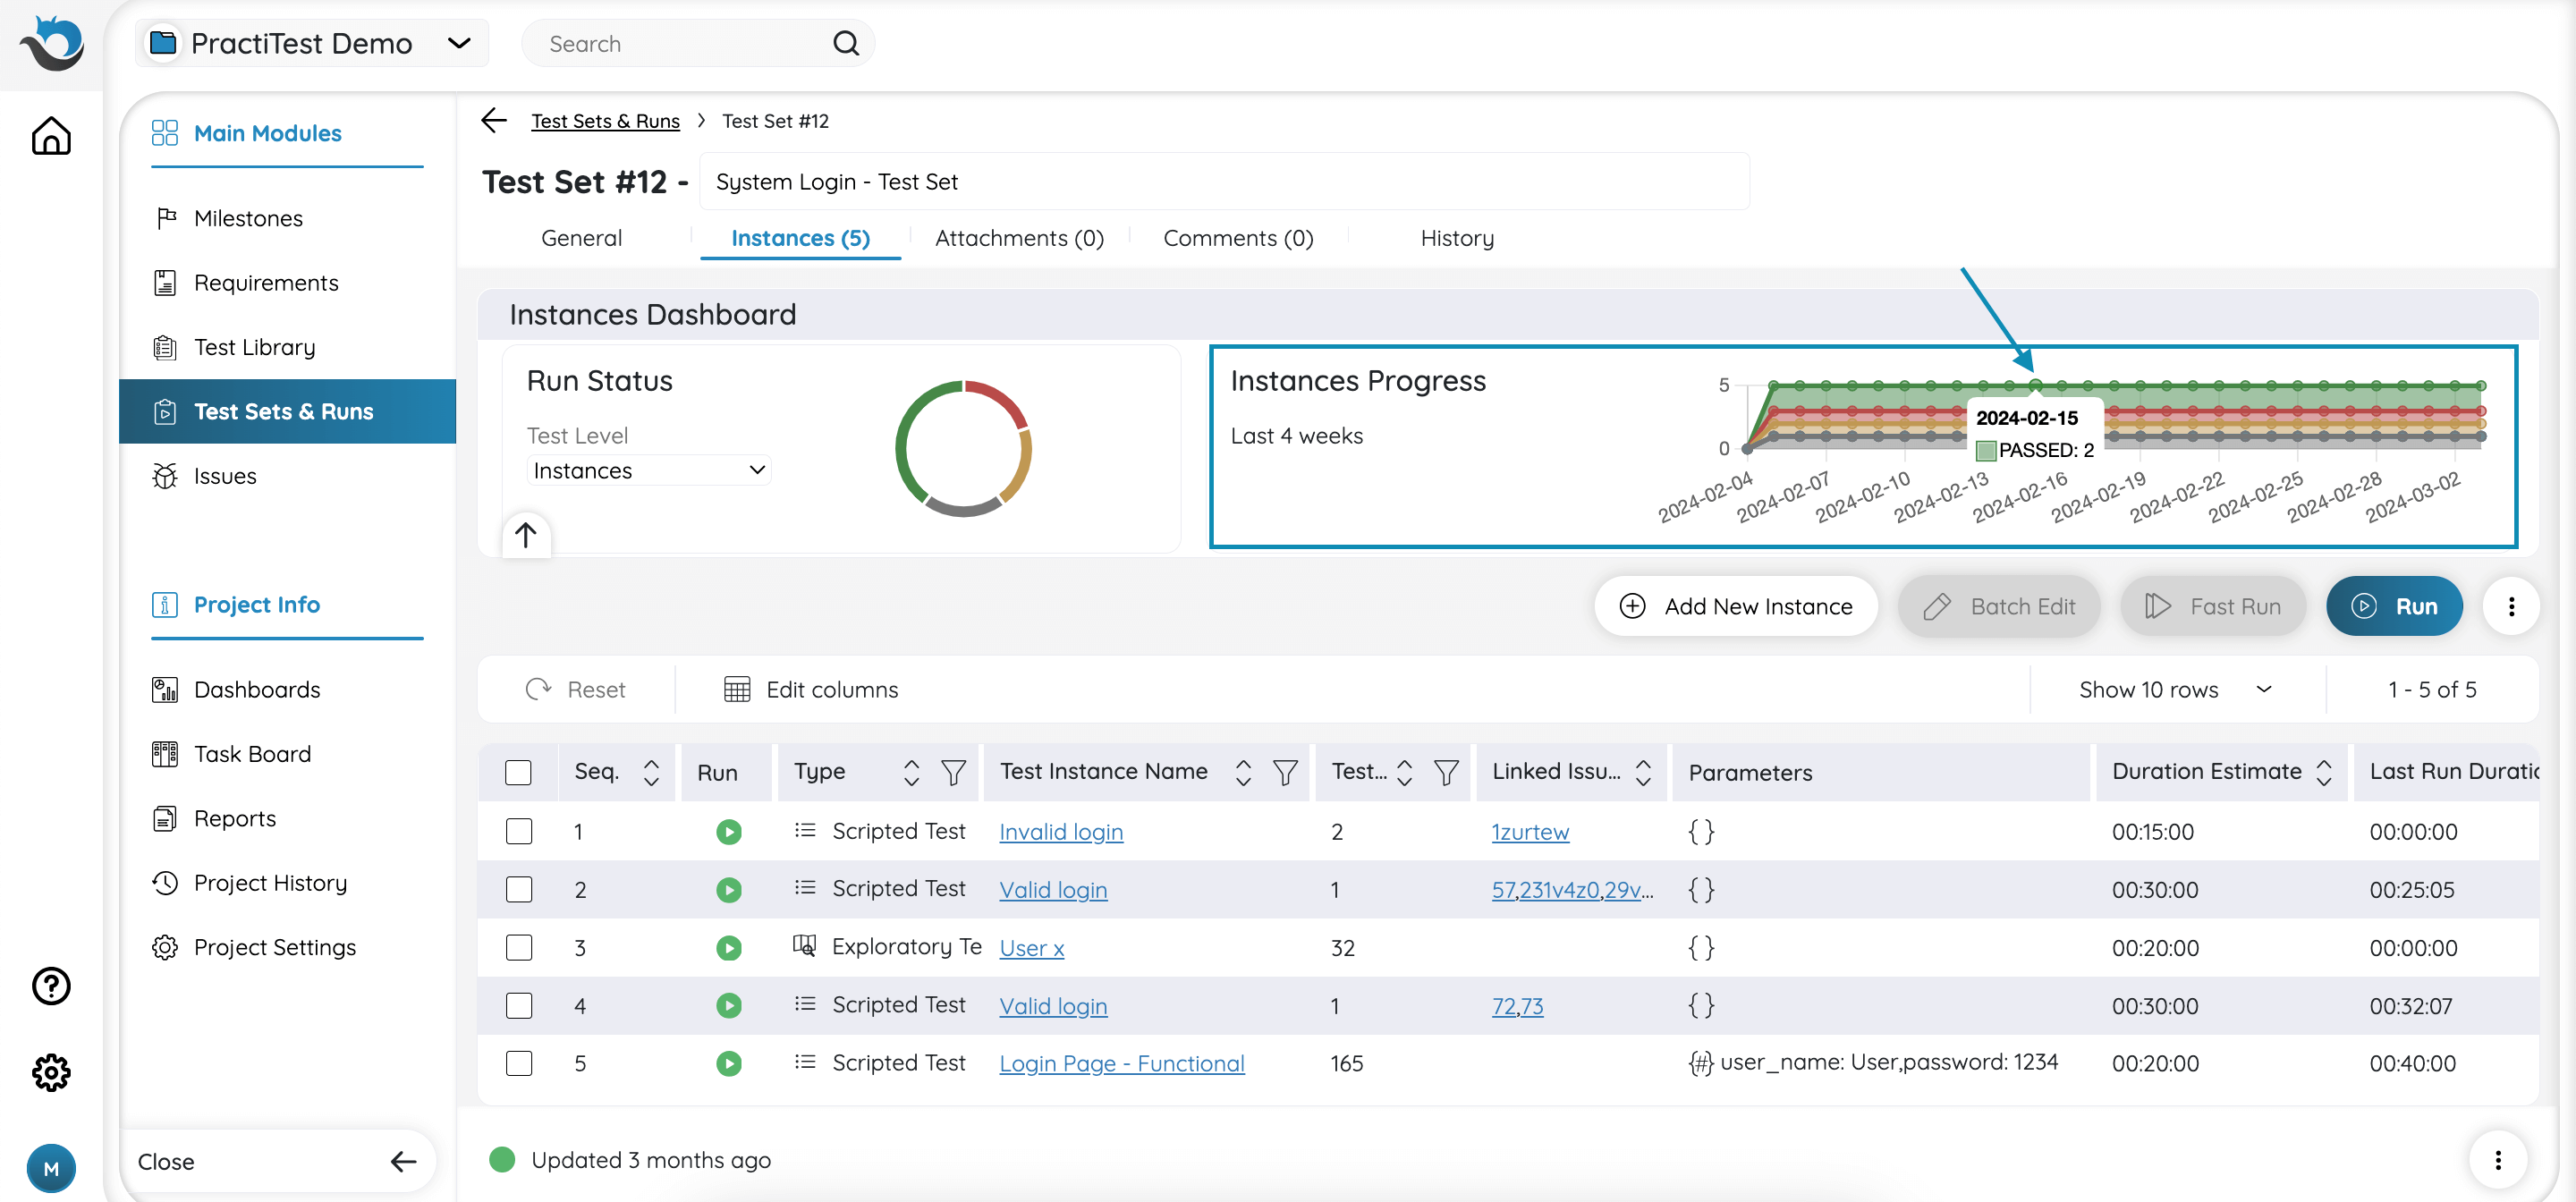
Next to the pie chart, you will find an Instance Progress graph of the last 4 weeks.
When hovering on a specific date in the graph, the instance count of each status at this date will appear.
Learn more about how statuses are calculated in PractiTest.
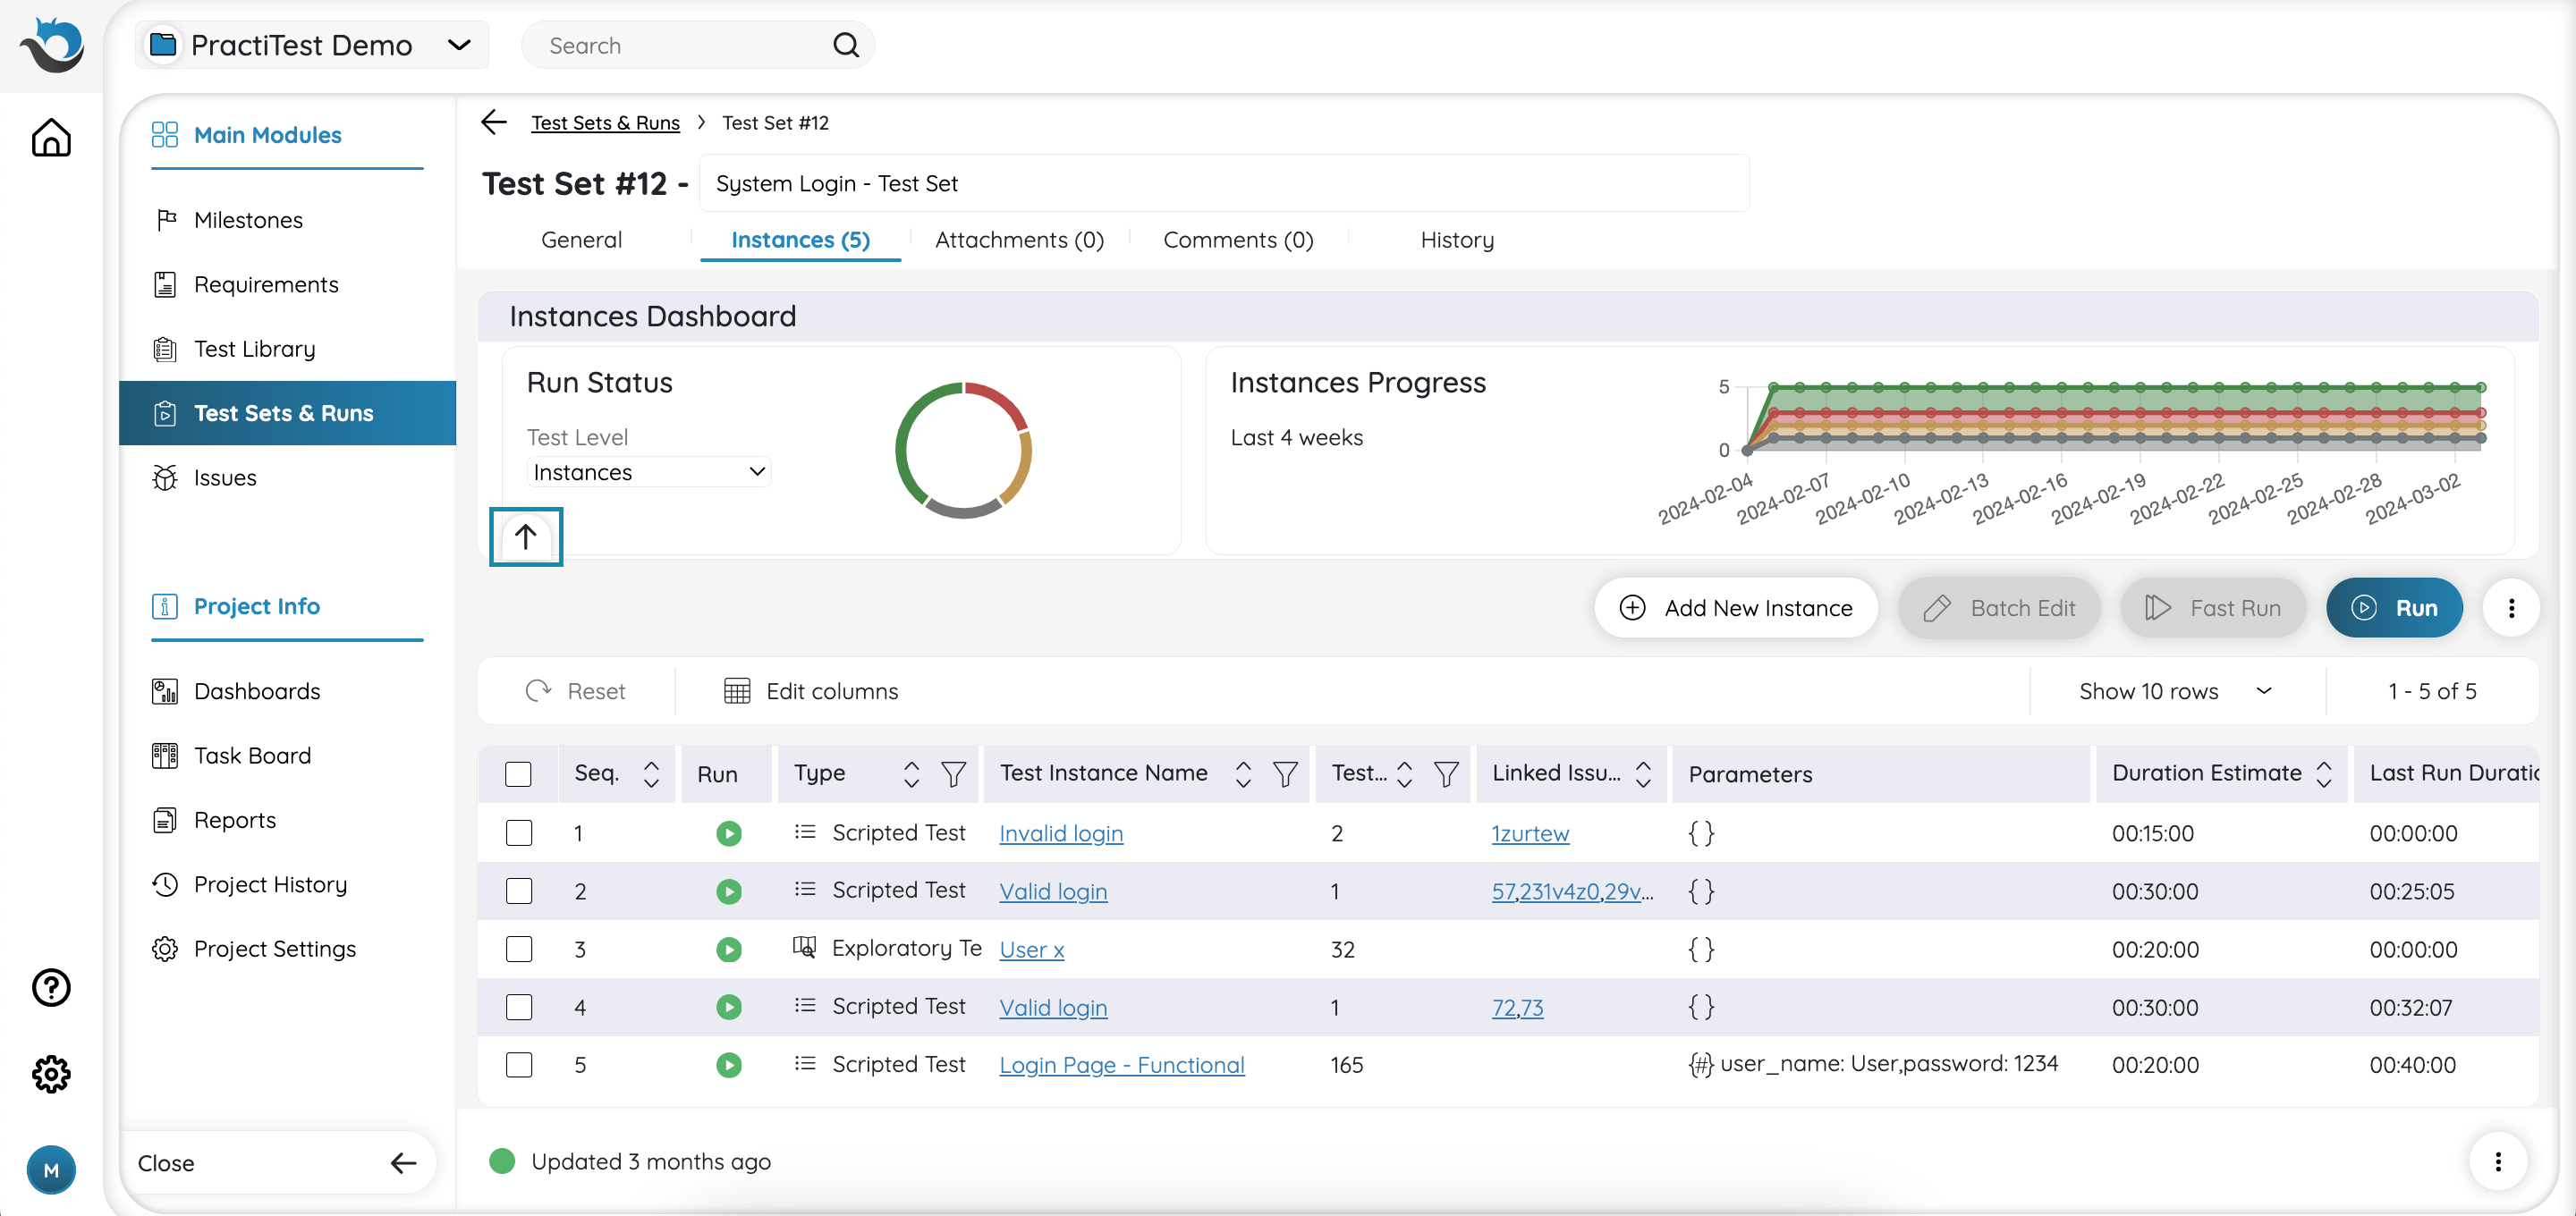
You can easily collapse the mini-dashboards by clicking the arrow up button at the lower part of the mini dashboards.
The Instance Grid
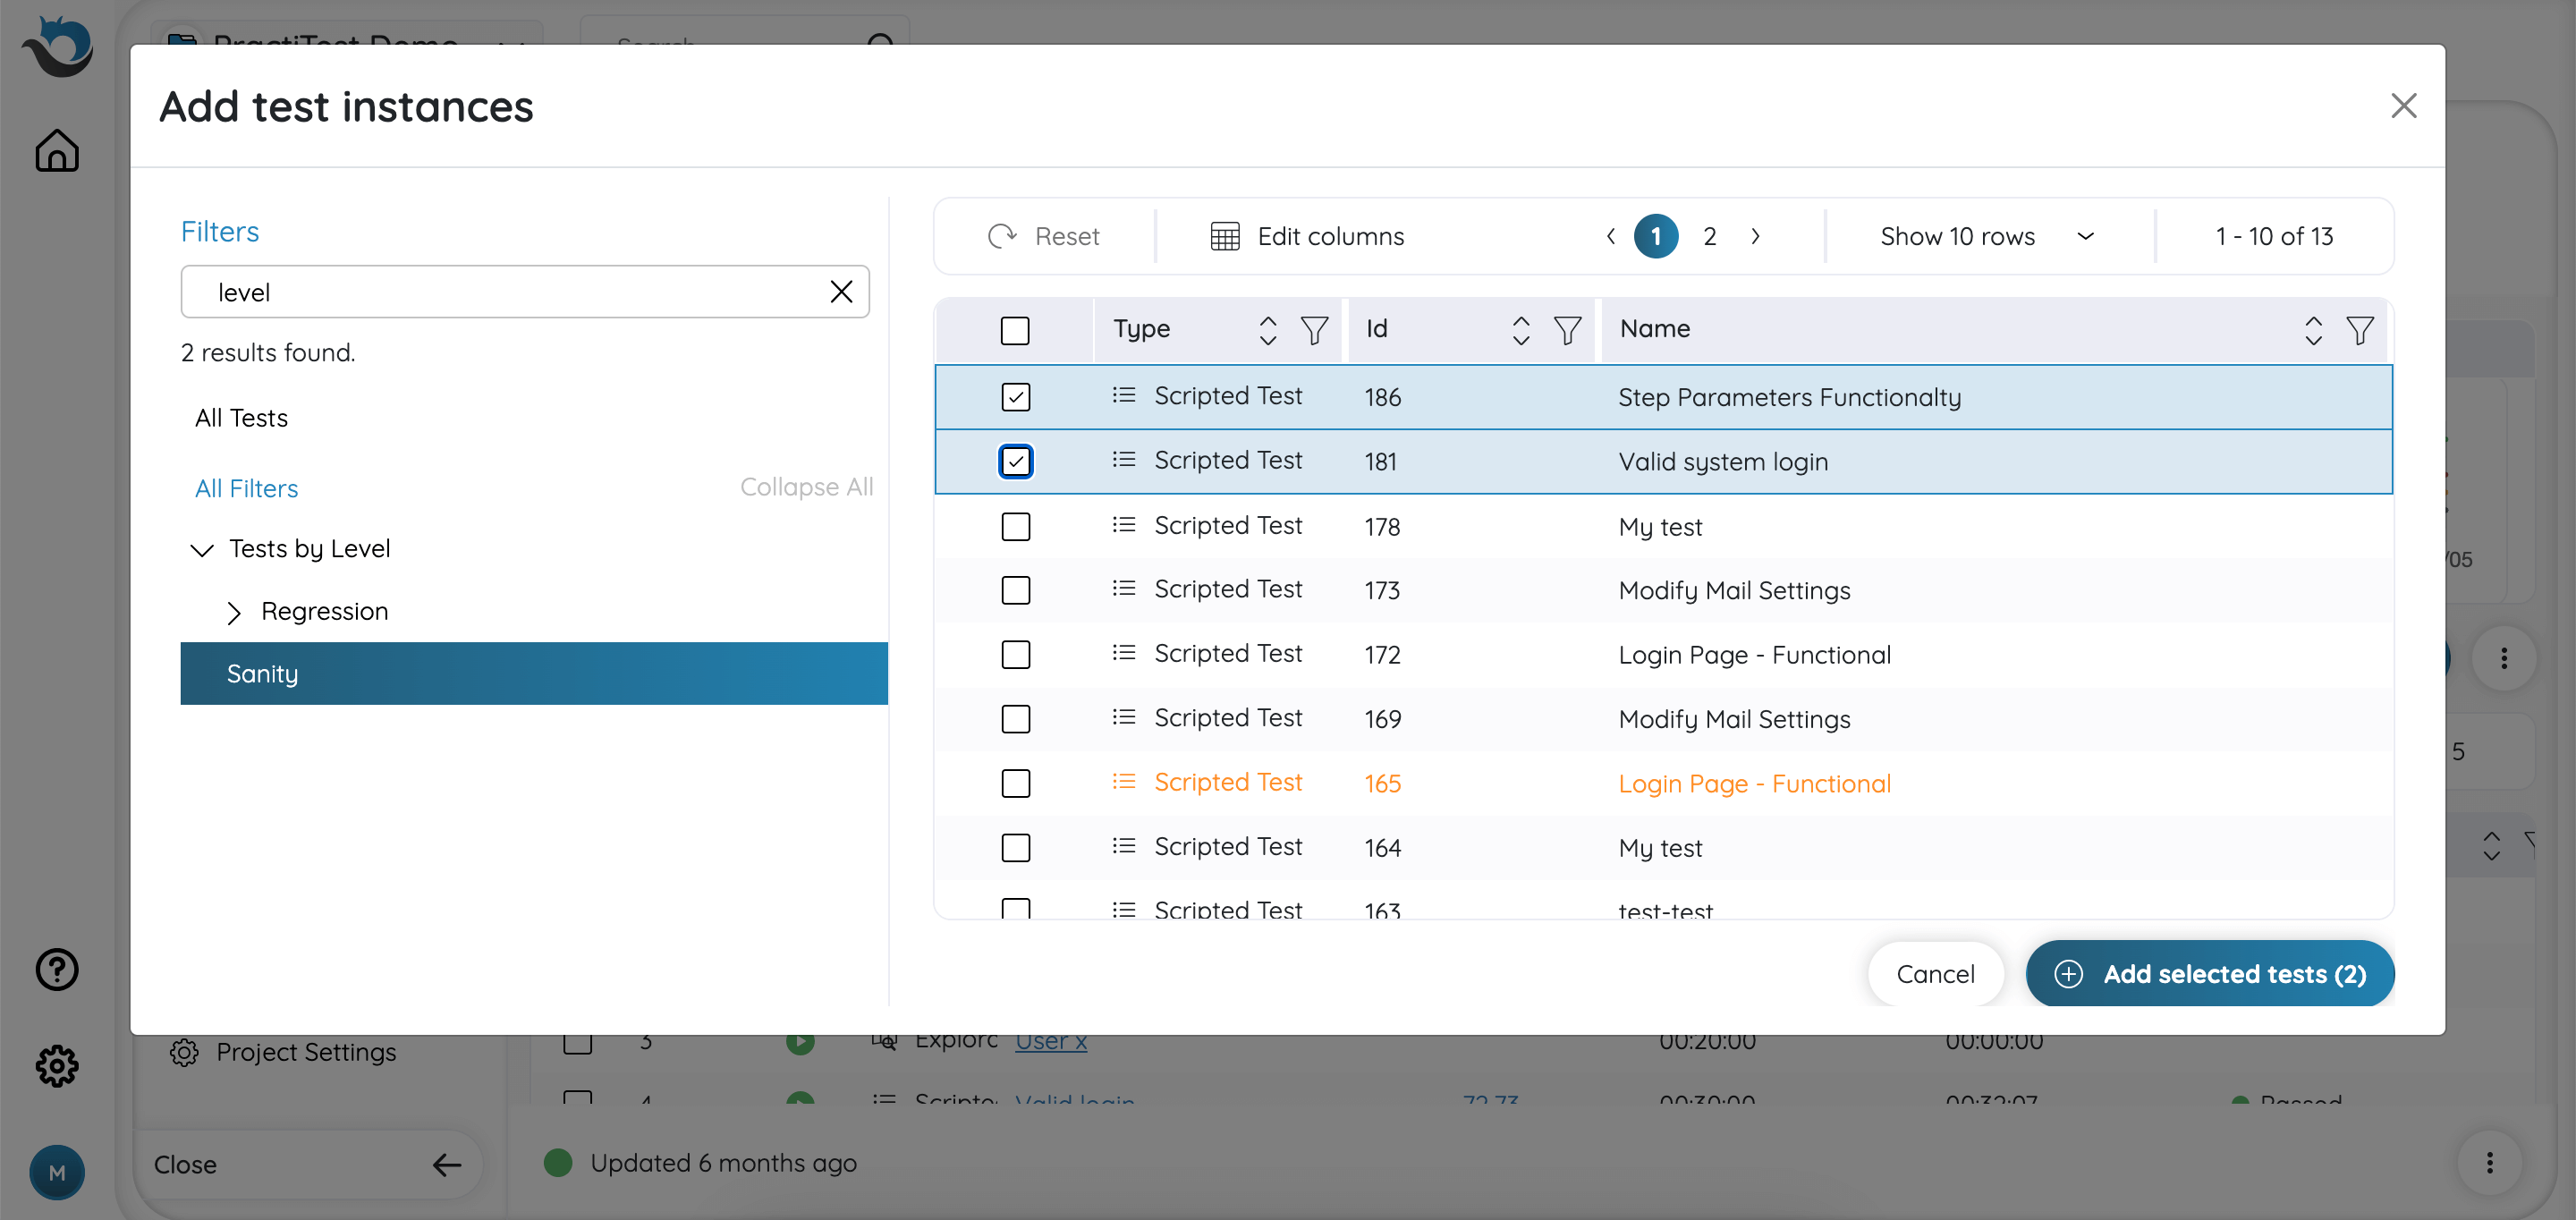
To add tests to your Test Set, click the ‘Add New Instance’ button.
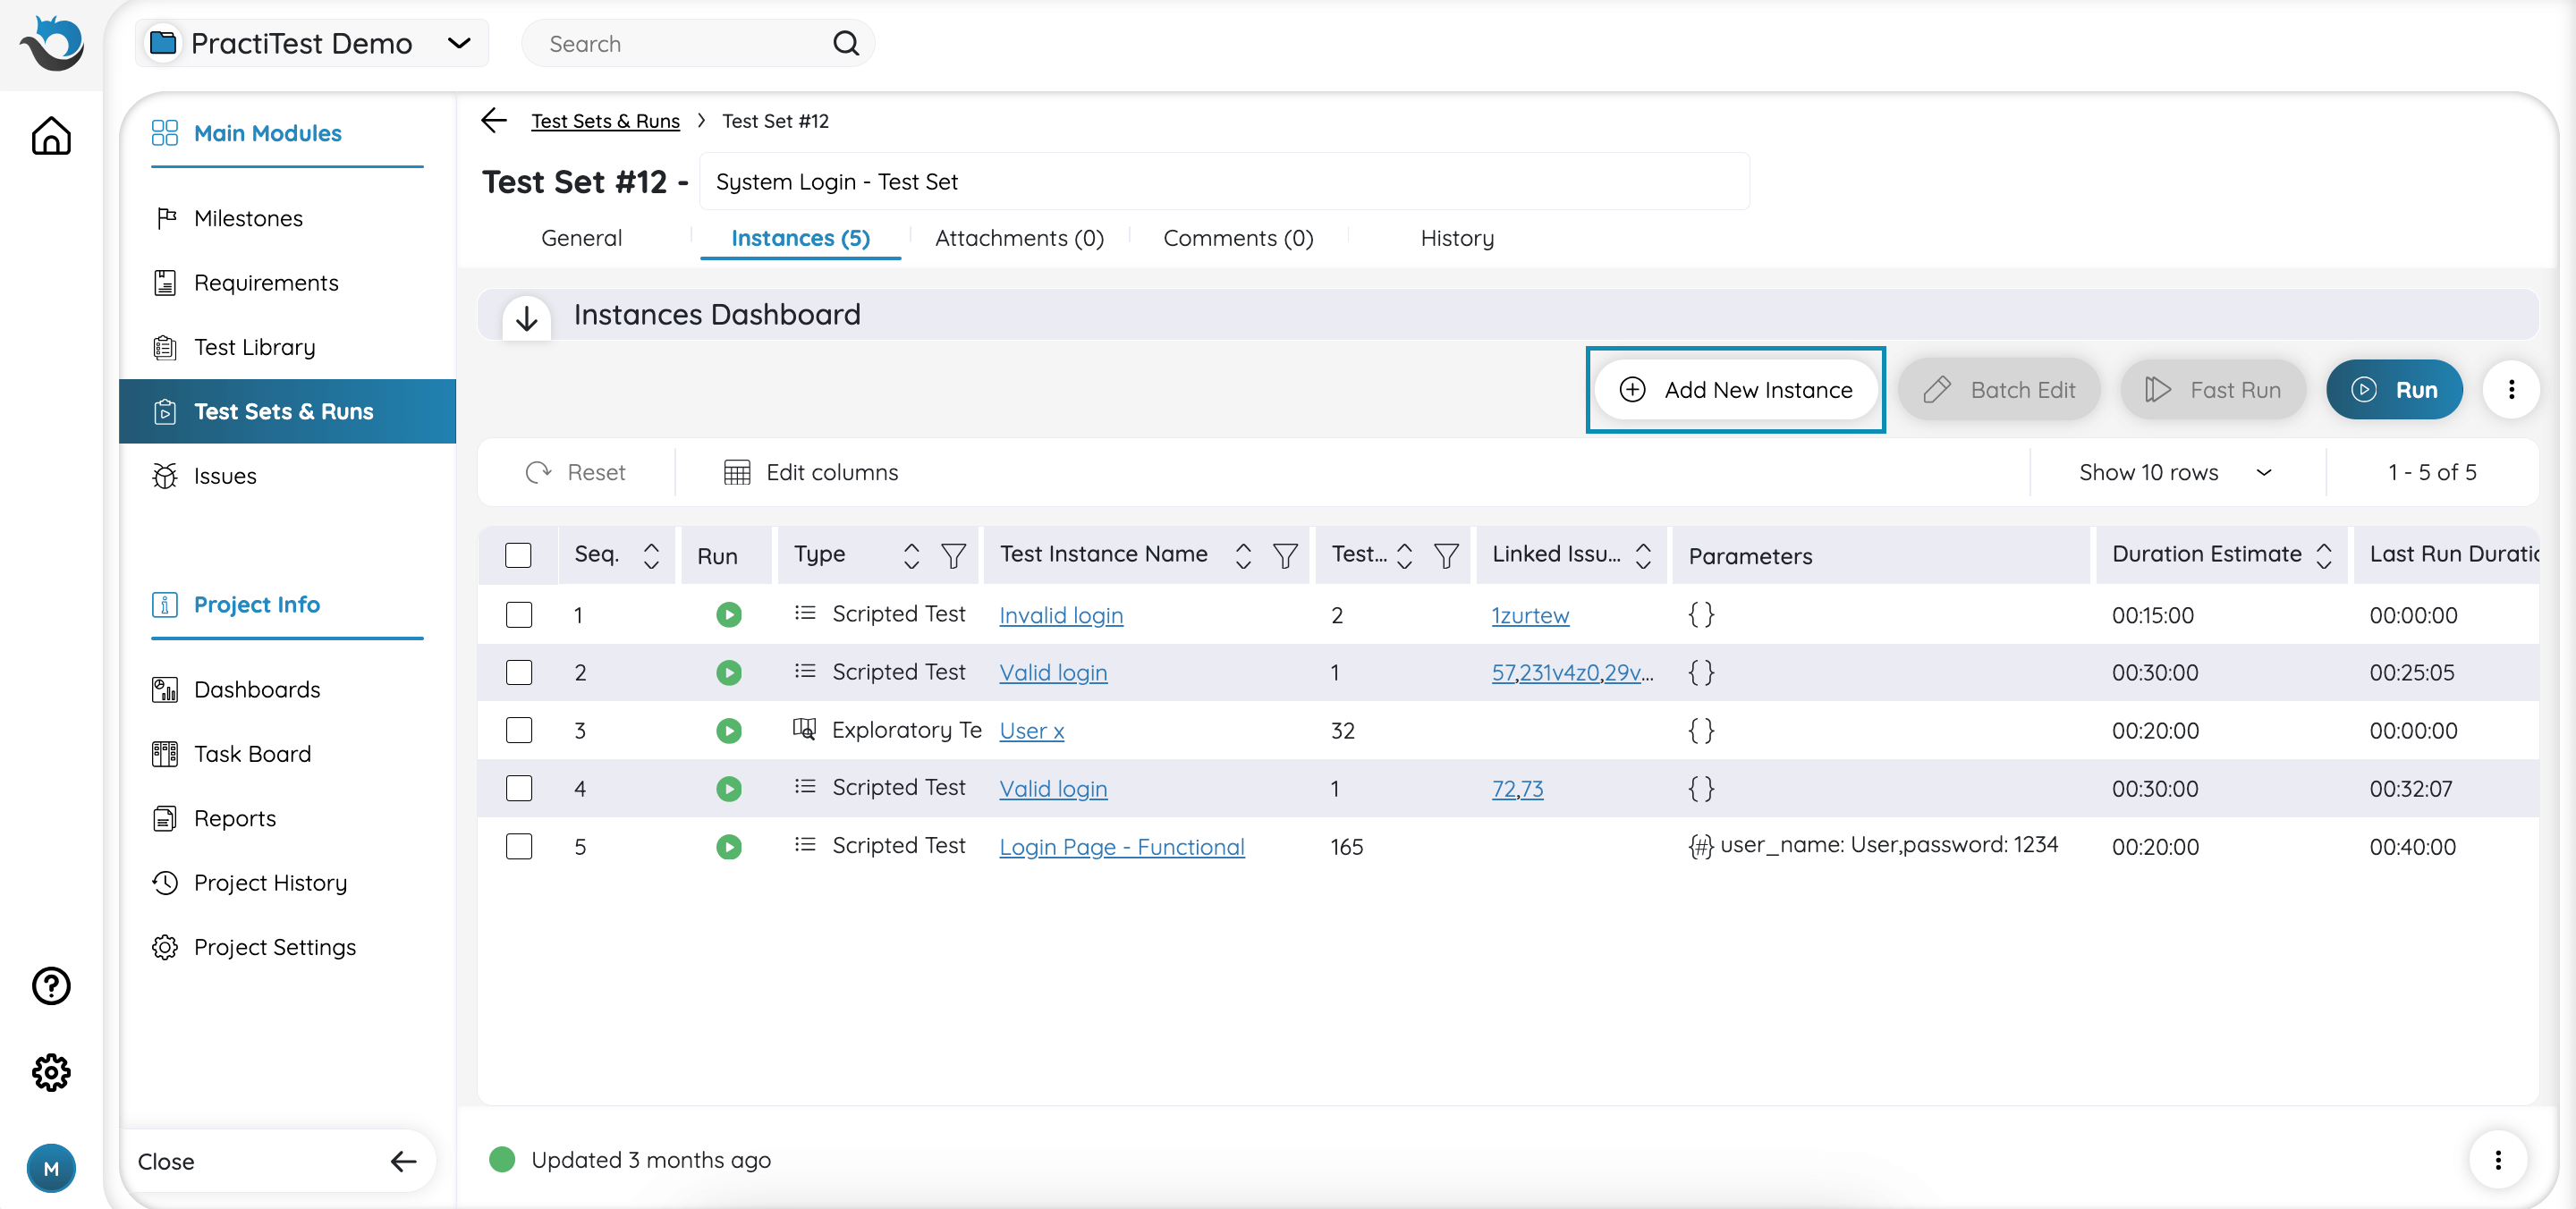
This will display a list of Filters and Tests available in the Test Library. Users can either choose a particular Filter from the list or search for a desired filter name to select tests. Then, select the tests you wish to include in their Test Set using checkboxes and click ‘Add selected tests’ to finish.
If you added a BDD test type that has examples (Scenario outline), PractiTest will automatically add multiple test instances for each example row in your BDD scenario outline test.
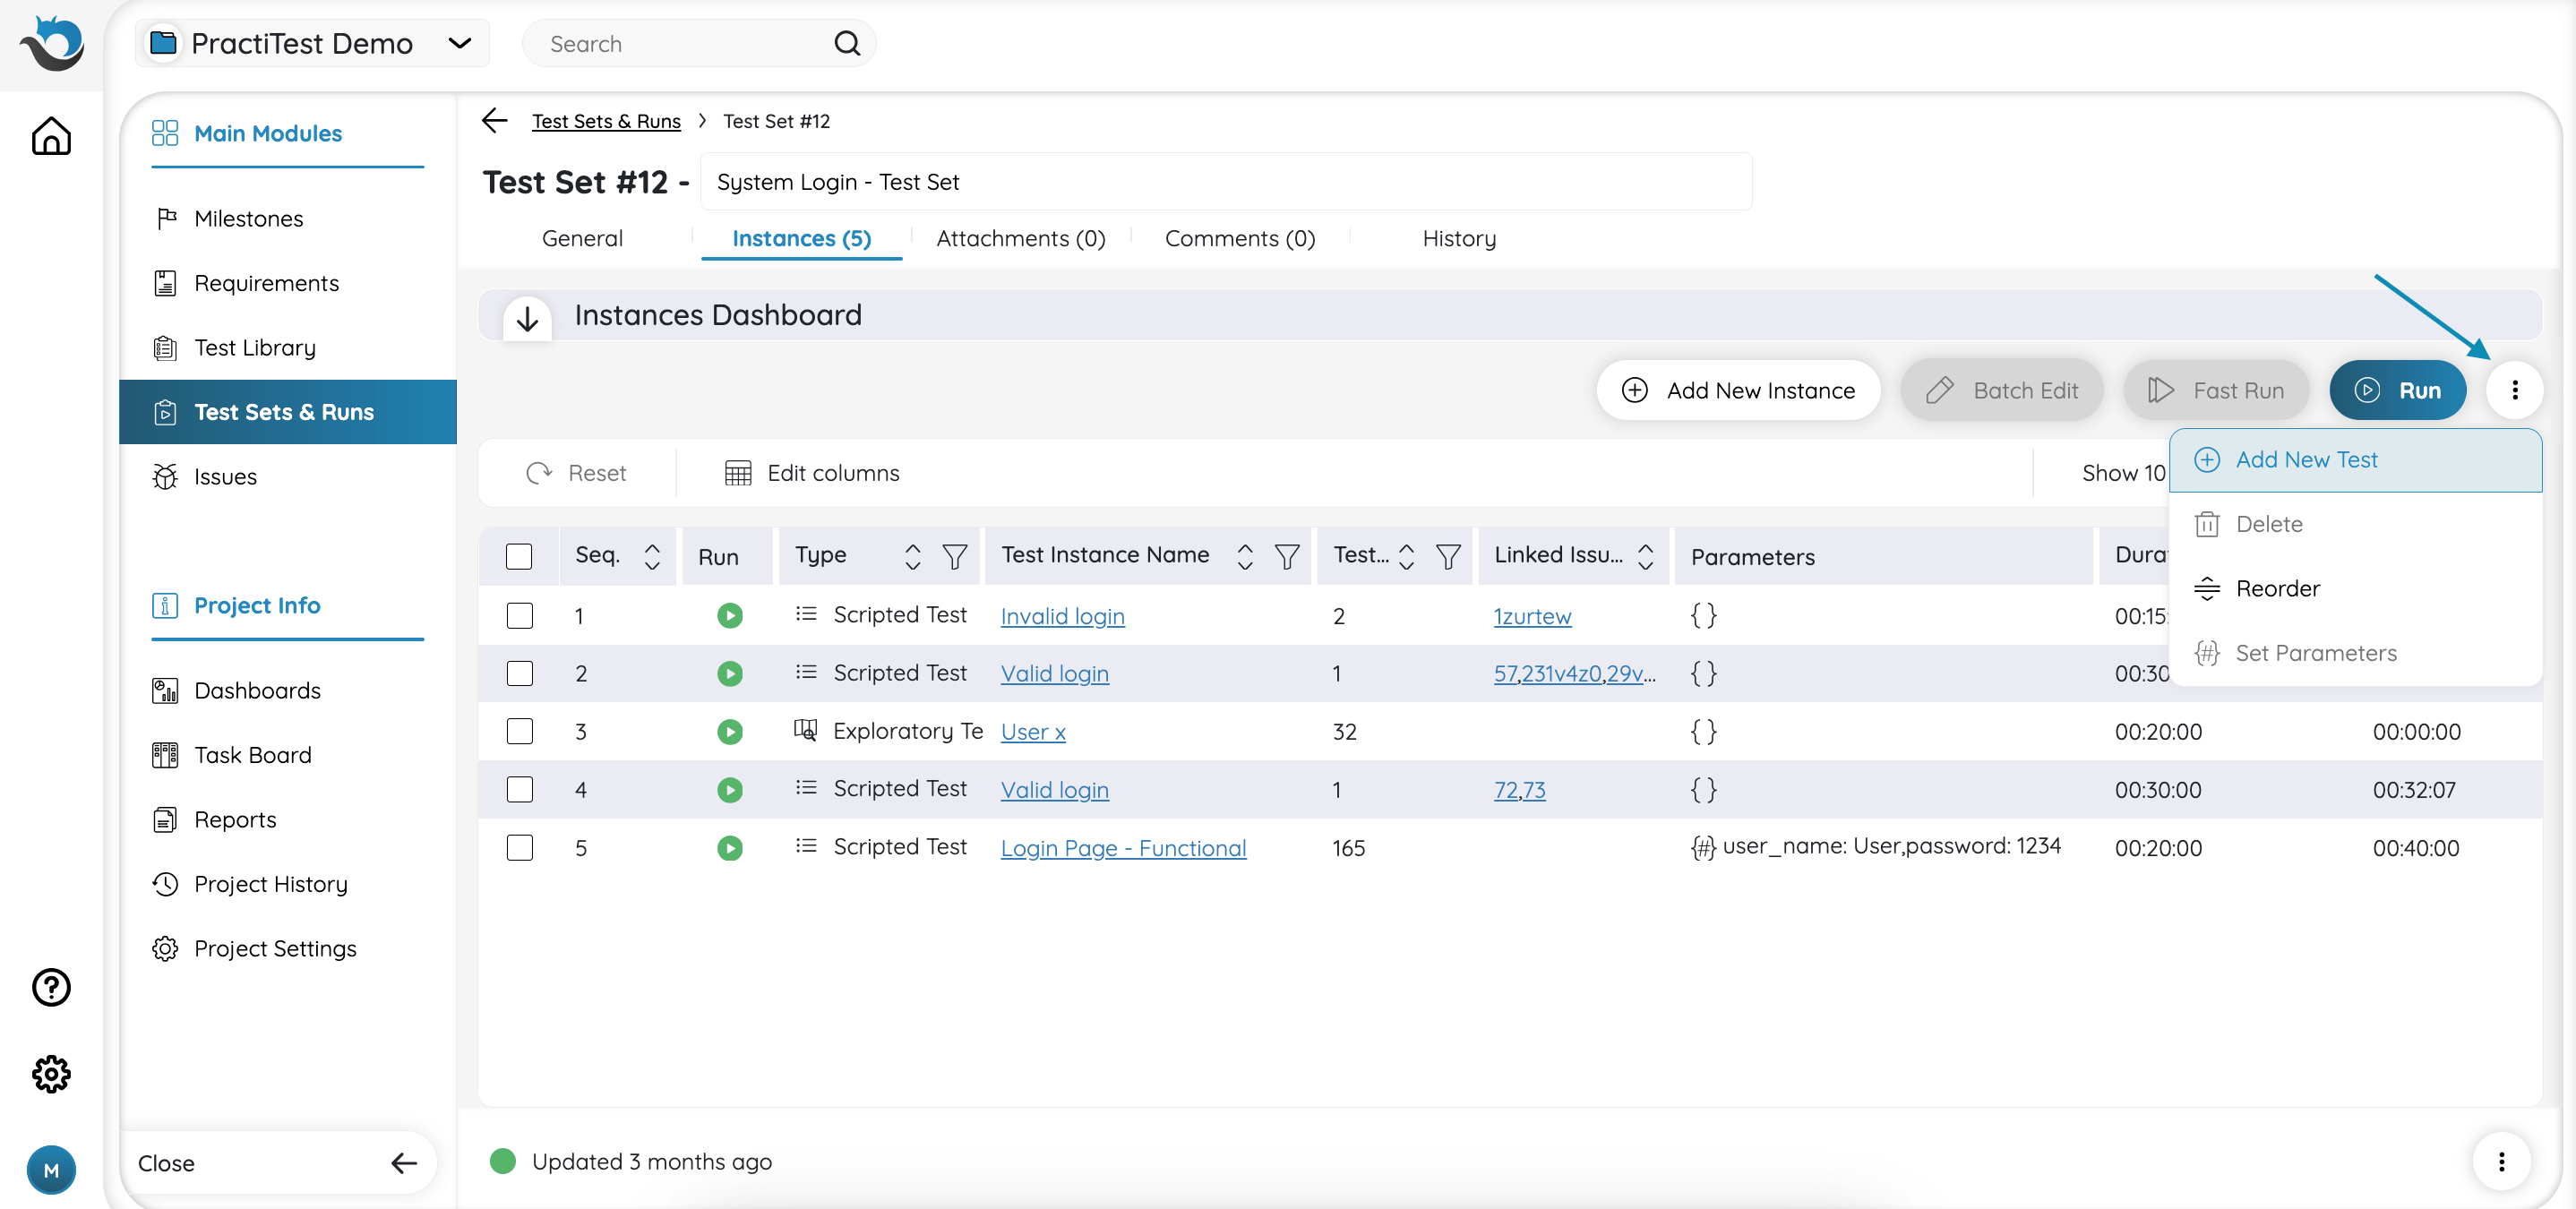
In addition, you can create a new test directly from a Test Set by clicking on the three-dot on the top right-hand side of the grid, and then click the ‘New Test’ button. After choosing your desired test type and naming it, press ‘Save Changes’ to save the test. The new test will be automatically added to the Test Set as a Test Instance, and will appear in the test library, as well.
You can create a Test Set directly from the Test Library based on chosen tests (read more about it here). This can also be done from the Requirements module based on the linked tests to the chosen requirements (read more about it here).
Note: Test Sets are limited to 2,000 test instances per set. Users who are project admins will be able to add up to 2,000 instances at a time. Users who are not project admins will be able to add up to 100 instances at a time.
Instances Actions
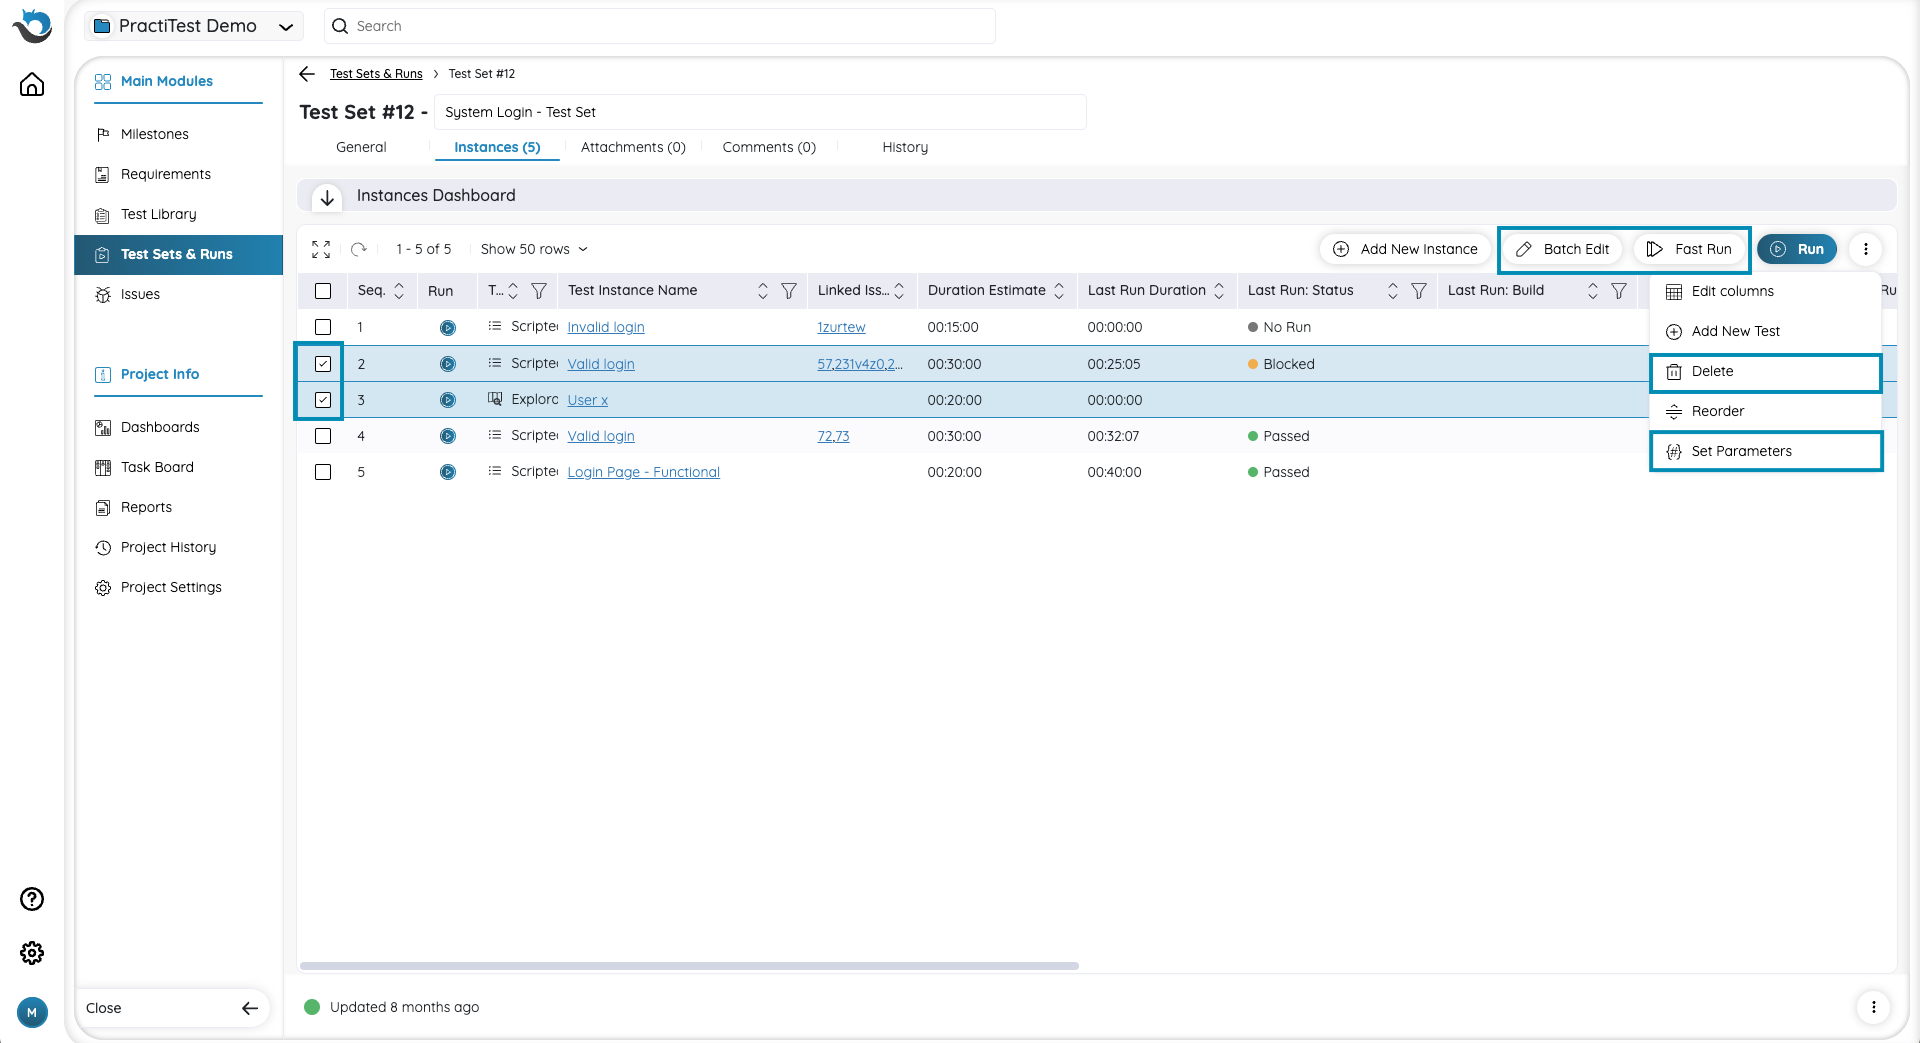
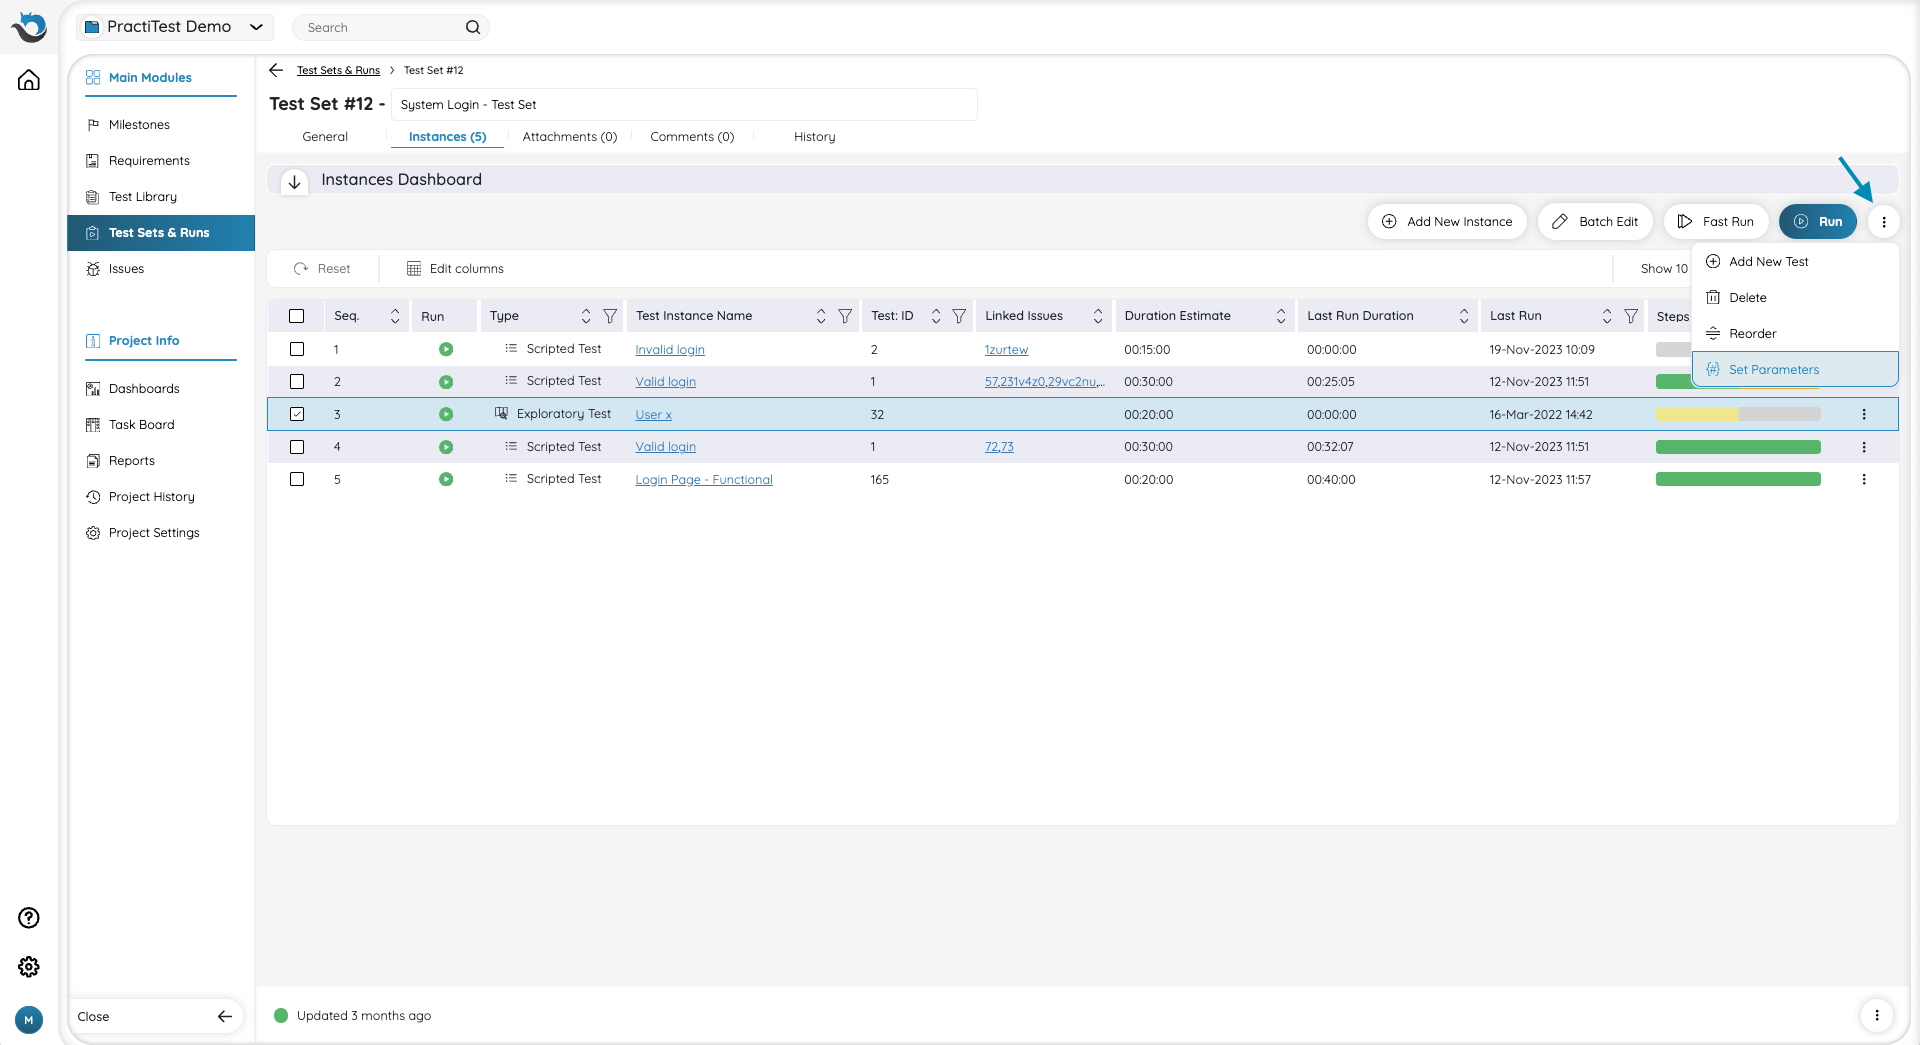
To perform a ‘Batch Edit’, ‘Fast Run’, ‘Delete’, and ‘Parameters’, first you must choose the instances you want and then the buttons will become available. ‘Edit’ and ‘Fast Run’ buttons appear at the top of the instance grid while ‘Delete’ and ‘Parameters’ will appear after clicking the three-dot button on the right-hand side.
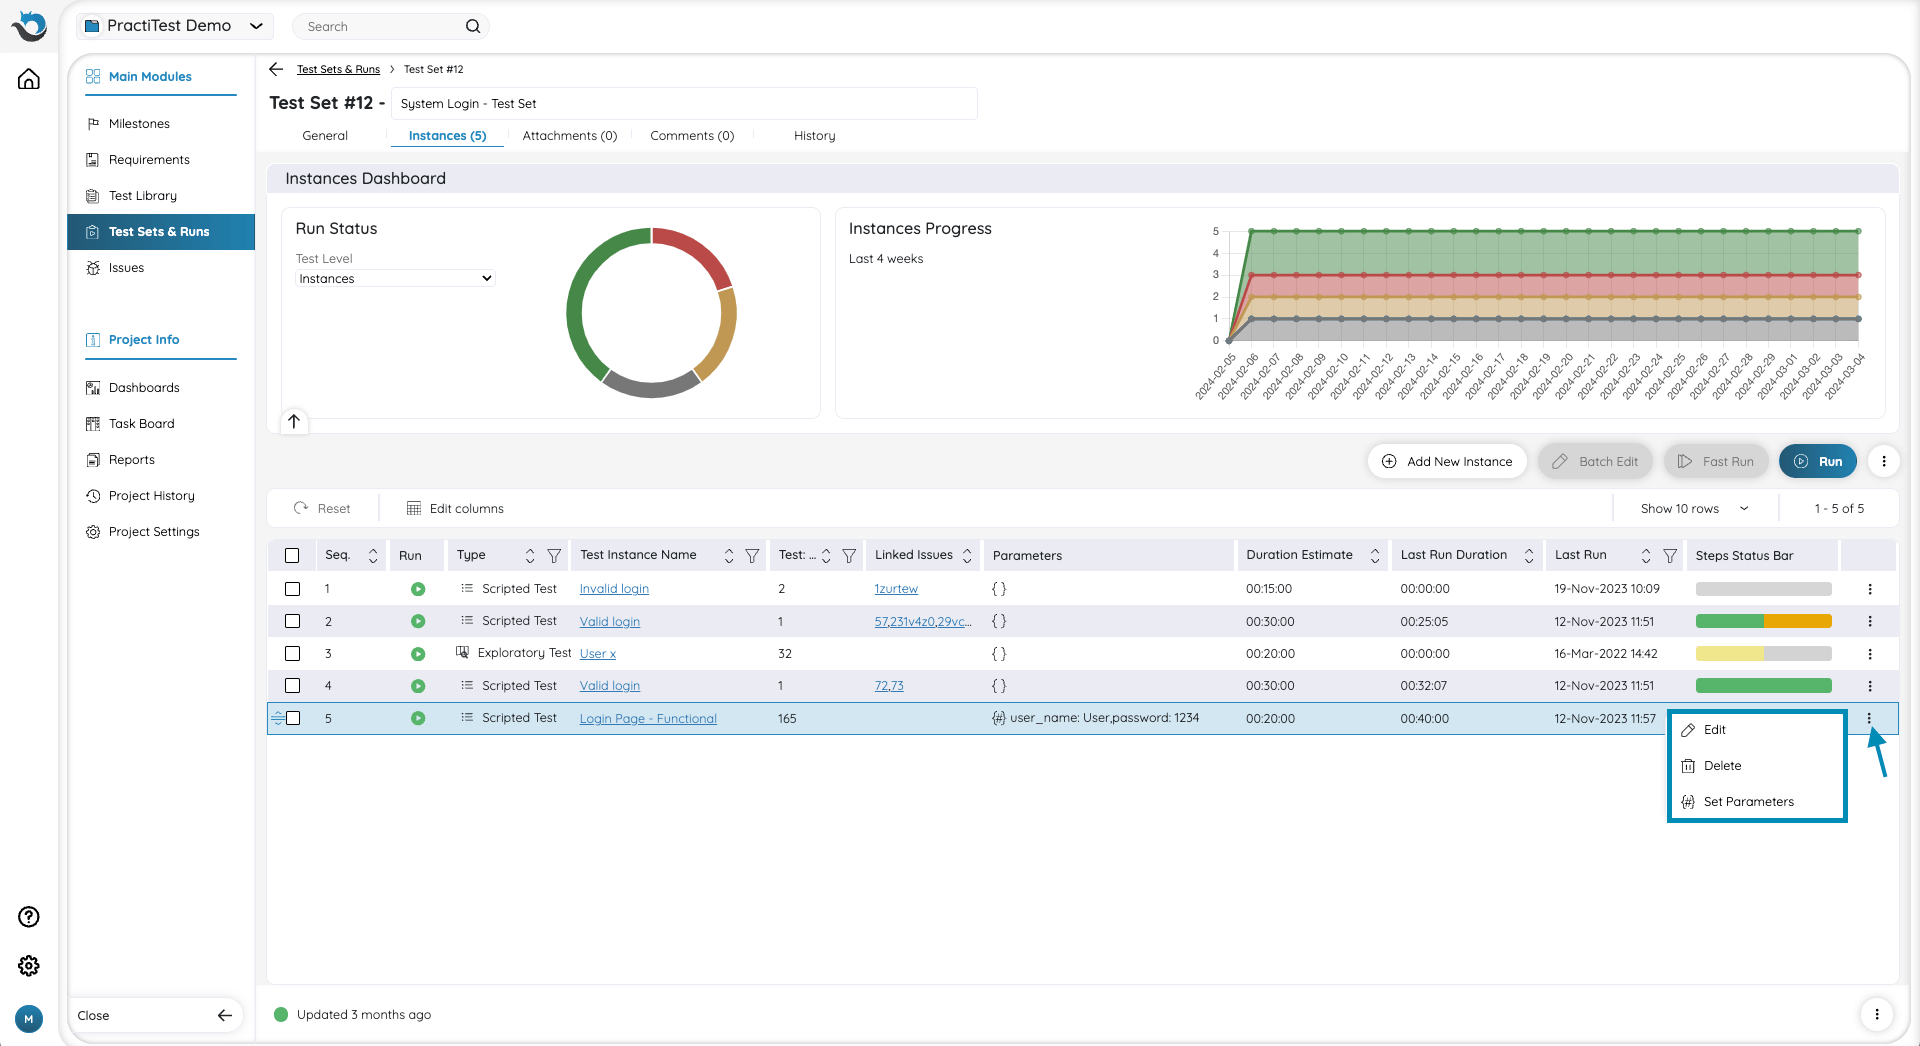
To edit, delete, or set parameters for a specific instance, scroll right in the instance grid, click the three-dot button in the corresponding instance row, and select your desired action.
Instance Grid Display
To enlarge the Instance Grid to full screen, click the ‘expand’ button located in the top left corner of the grid. Once the Instance Grid is expanded, you can return to the default collapsed view by clicking the same button again.
To define the displayed columns in the instance grid, click the 3-dot button and then choose ‘Edit columns’. A pop up window will appear, showing a list of all available fields to display. Each field has a toggle next to it. Choose the fields you want to display (or hide) by sliding the toggle. You can also change the order of the fields by dragging and dropping them in the columns pop-up window.
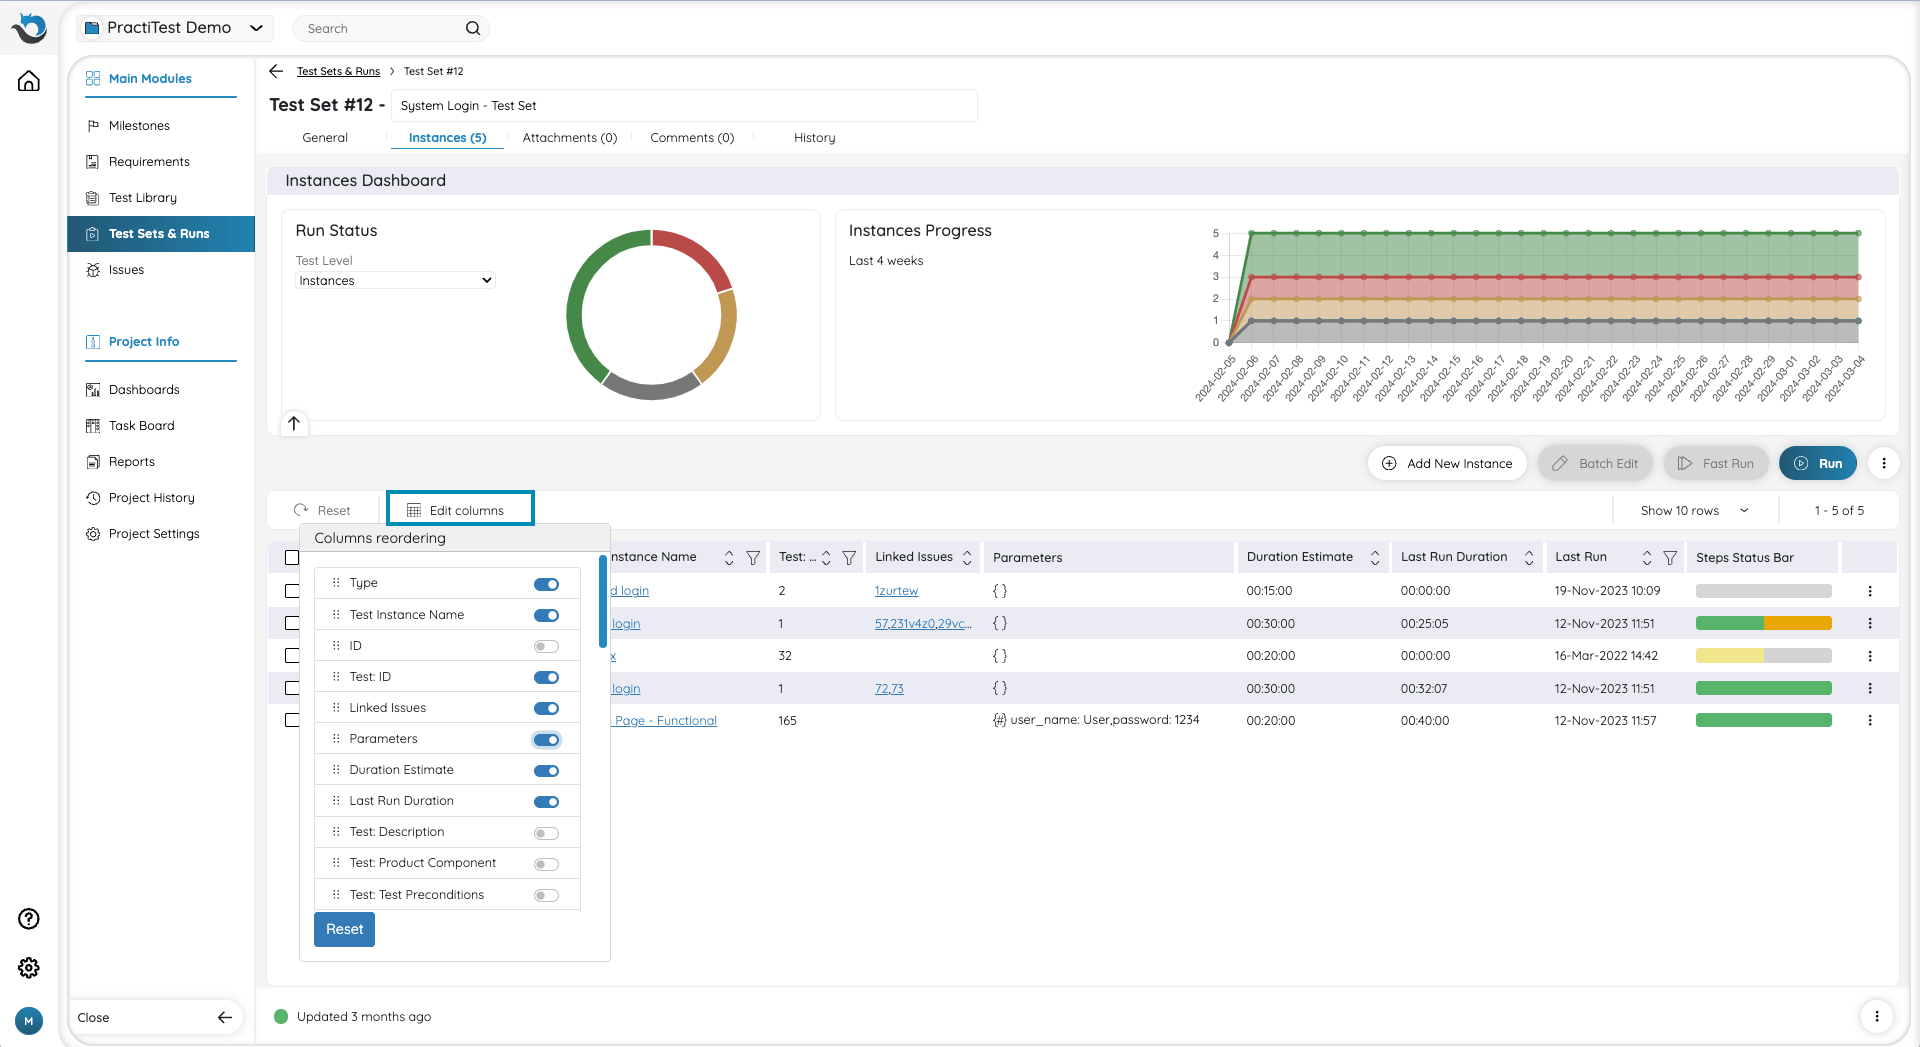
This can be used to display information you defined as fields in the Test Library (e.g., the platforms for which the test is relevant, tested component, test level, etc.) or information from Runs related to the instances (e.g., build number of your last run).
Note: Fields that are displayed as ‘Test: Field-Name’, or ‘LastRun: Field-name’, are the fields from the Test Library or from runs that you can display in the Test Instance grid.
Instance Grid Sequence
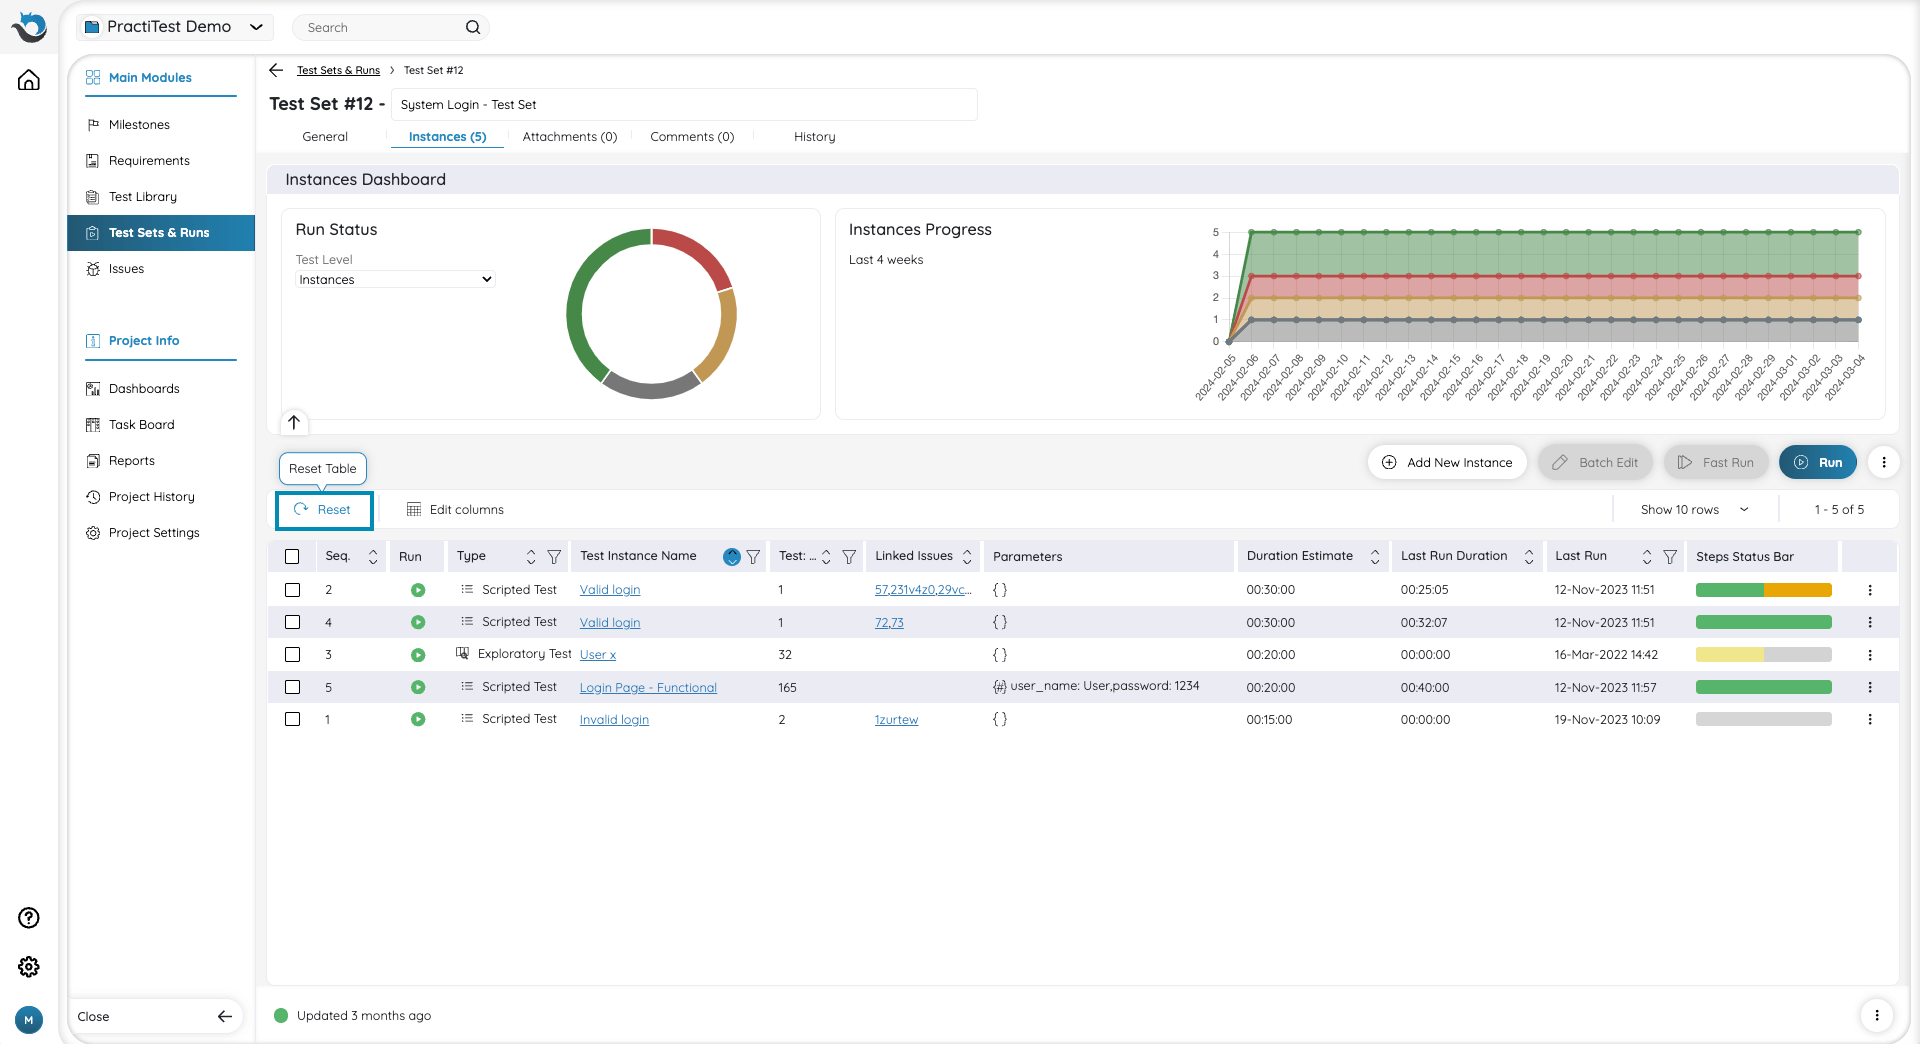
The default execution order of instances within the Test Set is represented by the sequence column in the instance grid. Instances with lower sequence numbers (e.g., 1, 2, 3…) appear at the top of the grid in descending order. You can adjust the default execution order by dragging instances up or down on the left side of the grid (next to the checkbox) or by clicking the three-dot button and choosing ‘Reorder’.

You can also sort instances based on different columns such as name, type, or last run status for example, you can easily get back to the regular sequence order view by clicking the ‘Reset’ button at the top left-hand side of the grid.
Enforce Run Order
This capability is only available for Ultimate or Corporate licenses
The ‘Enforce Run Order’ option mandates the ability to run tests according to their sequential order in the instance grid, one after the other. For example, the execution of test number 3 is only possible after the completion of test number 2
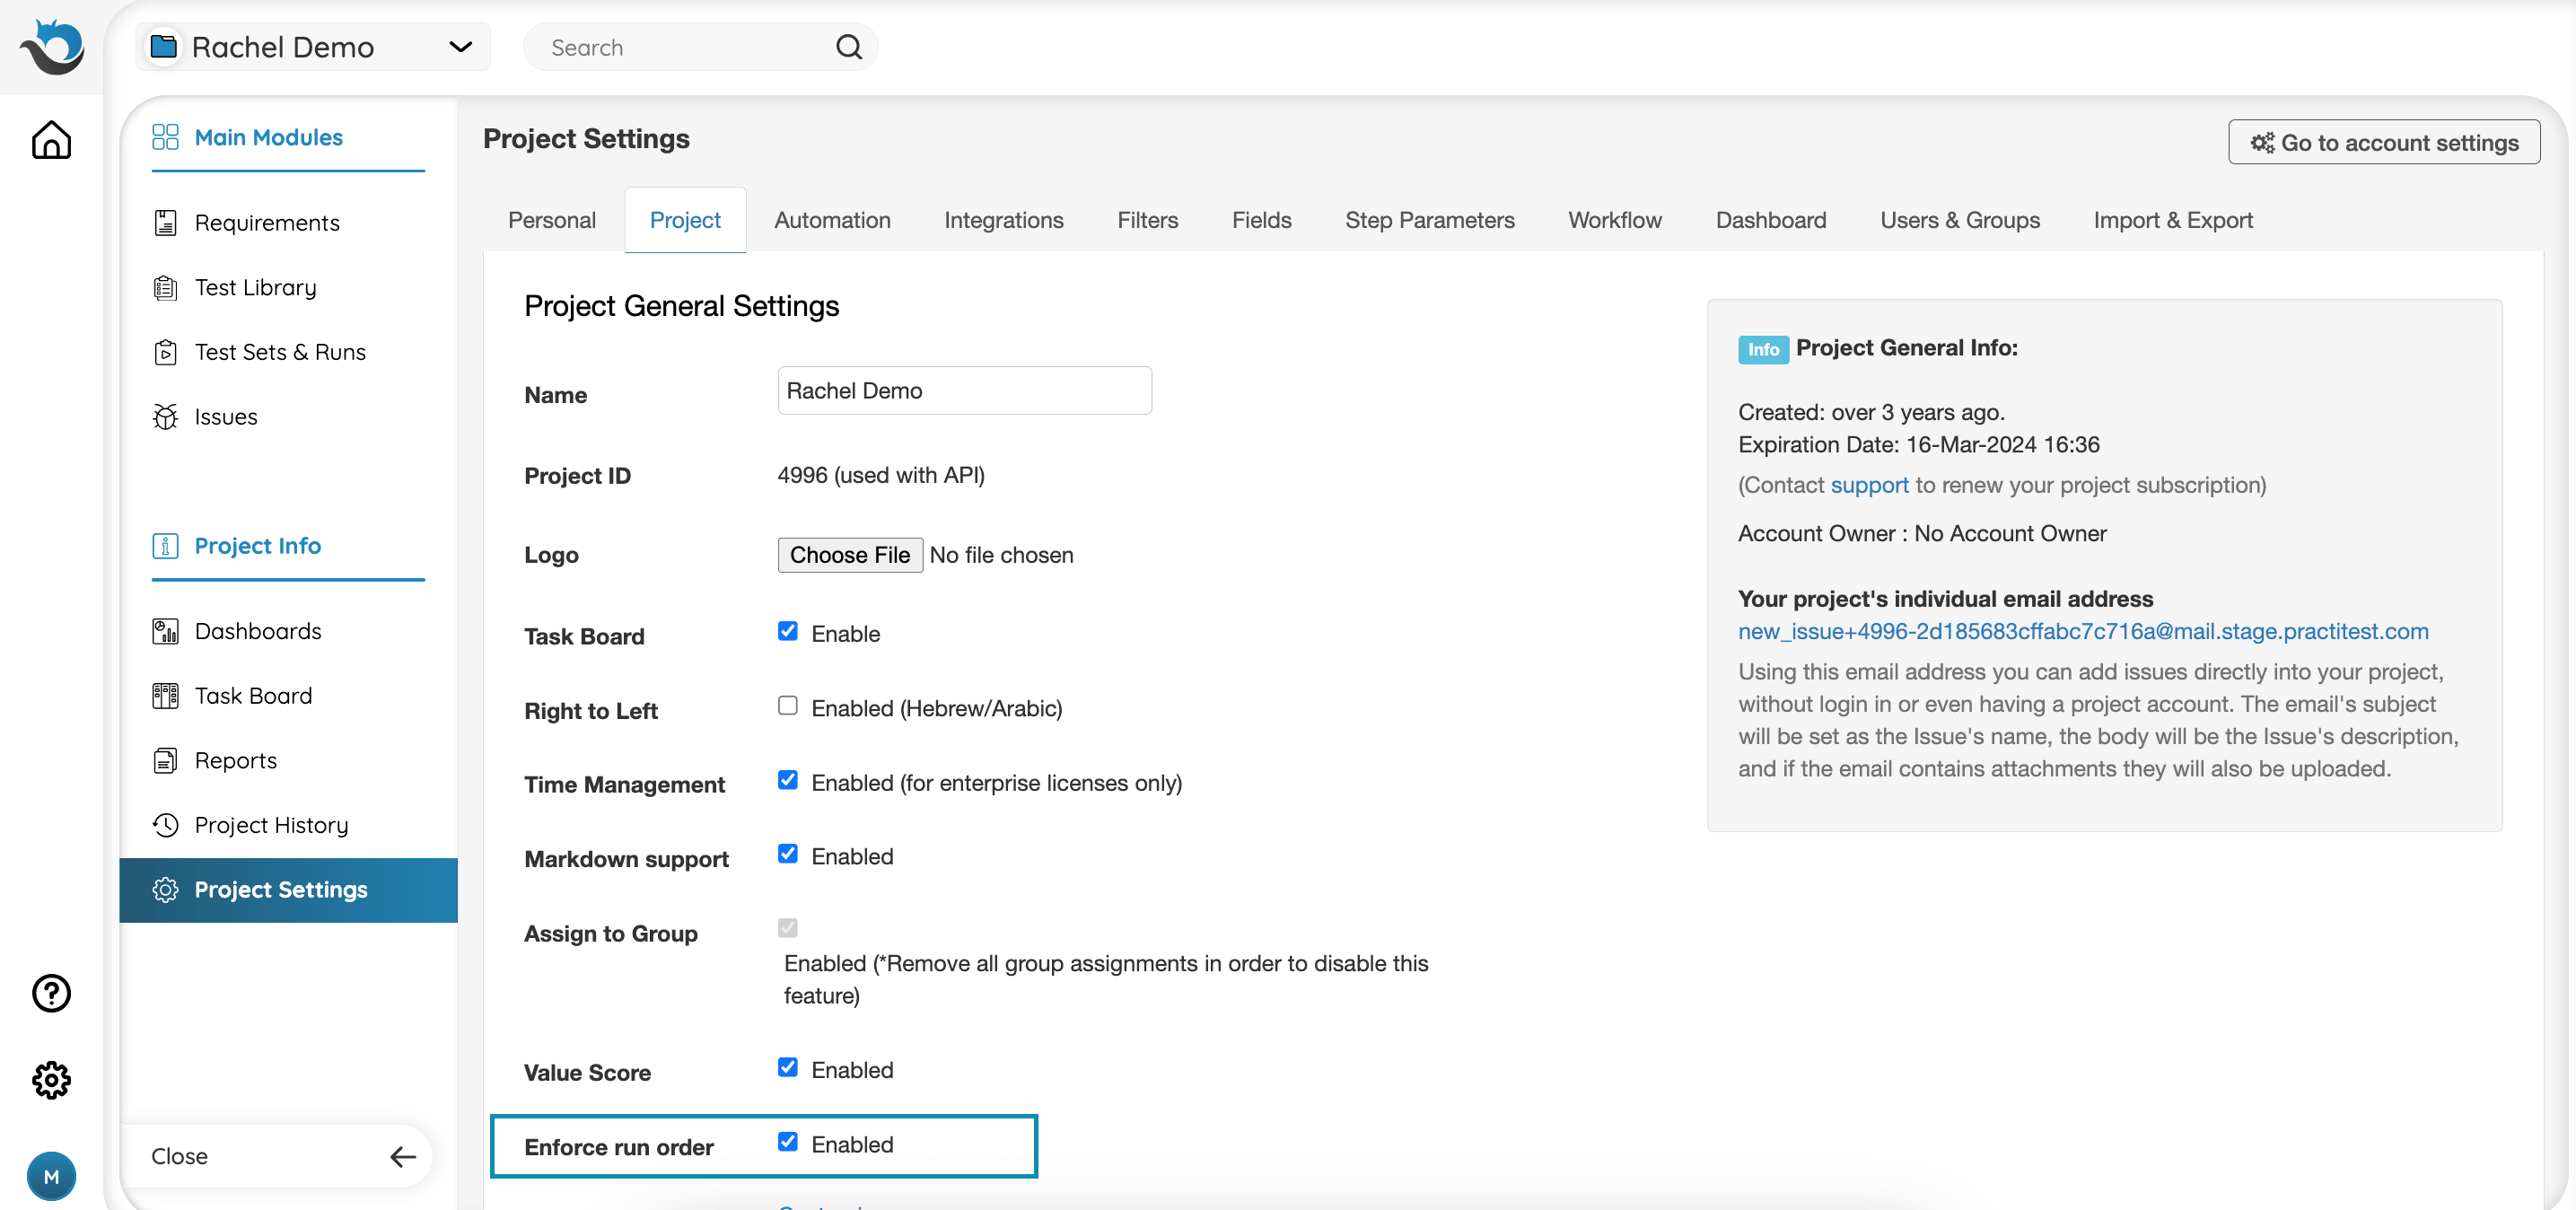
To enable this ability:
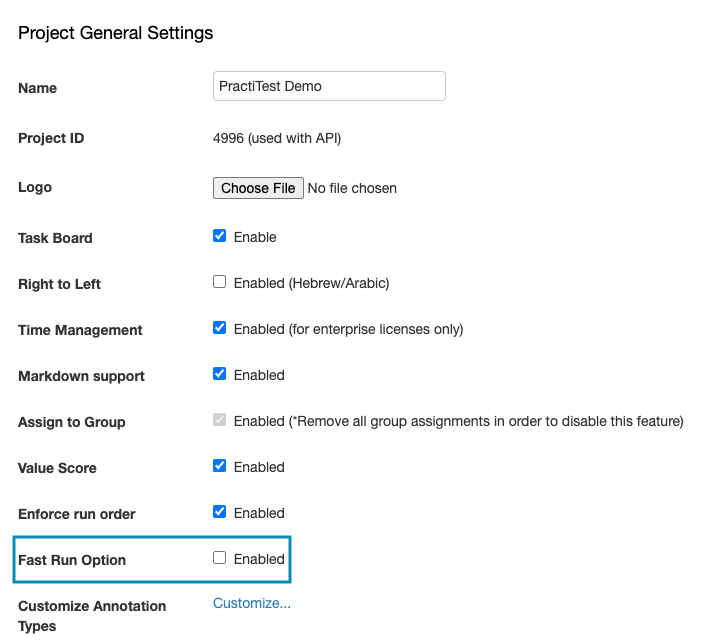
- Head to the Project Settings > General Settings Tab.
- Tick the ‘Enforce Run Order’ checkbox.
By enabling this capability, testers who are assigned to a test will receive an email notification once their test is ready to run and the previous one is completed.
Note: Enforce run order only applies for the first run of each instance. Once the instances have been run, the enforce run order setting will no longer apply.
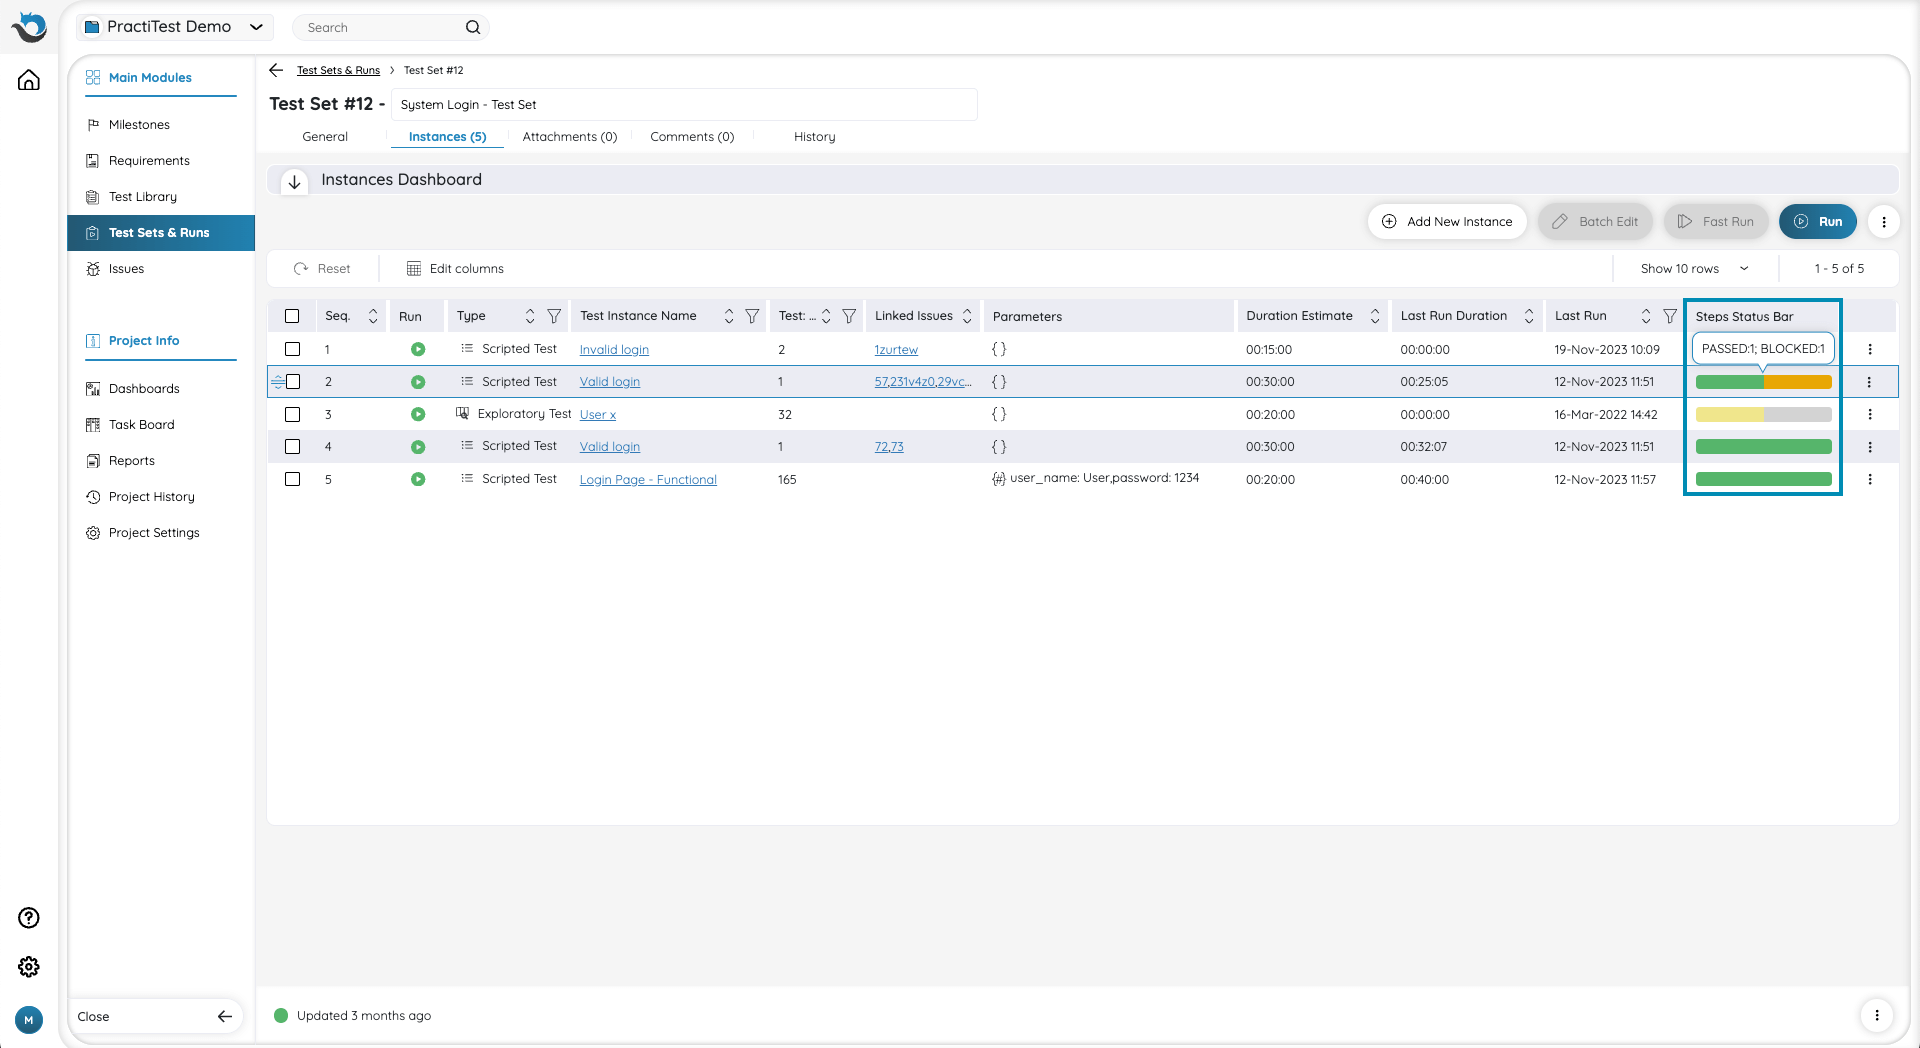
Step Status Bar
The instances grid includes a bar which visually displays the status of your steps within the last test run of each instance. Simply hover your mouse over the bar to see how many steps are in each status.
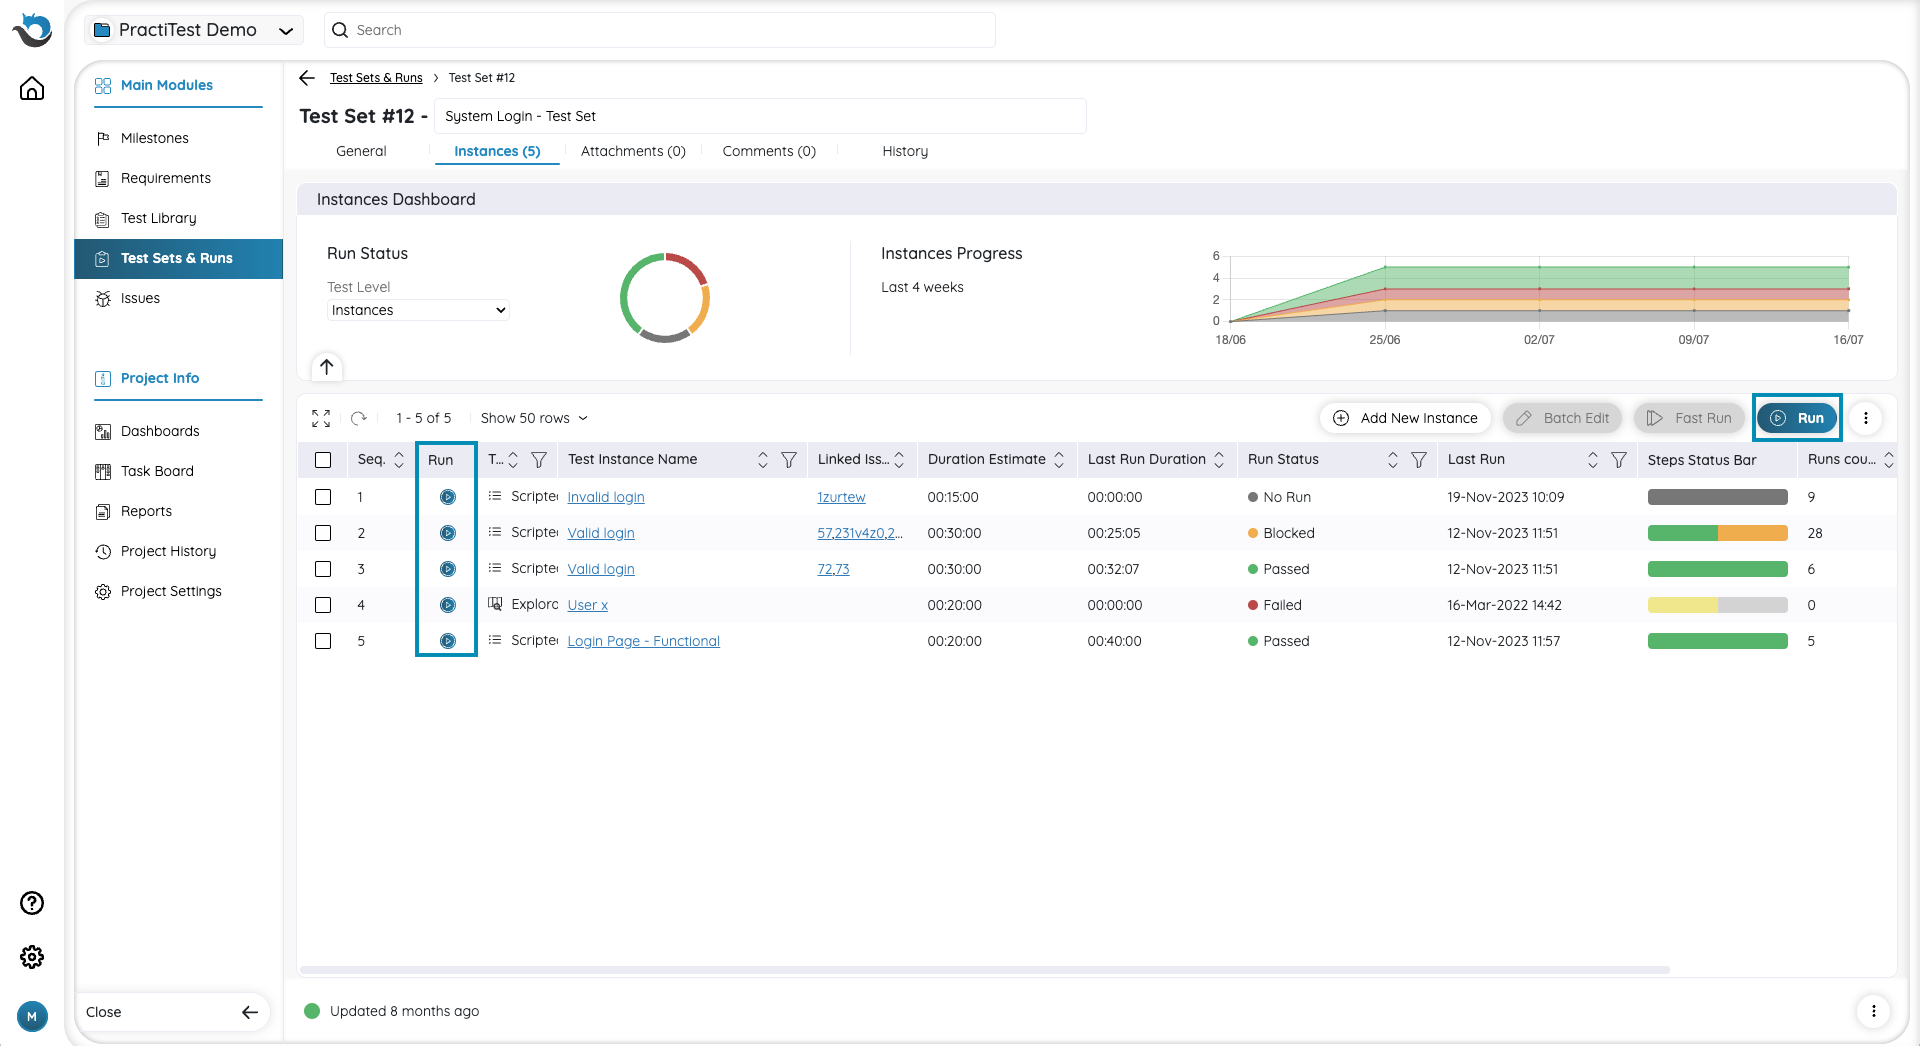
Run Your Tests
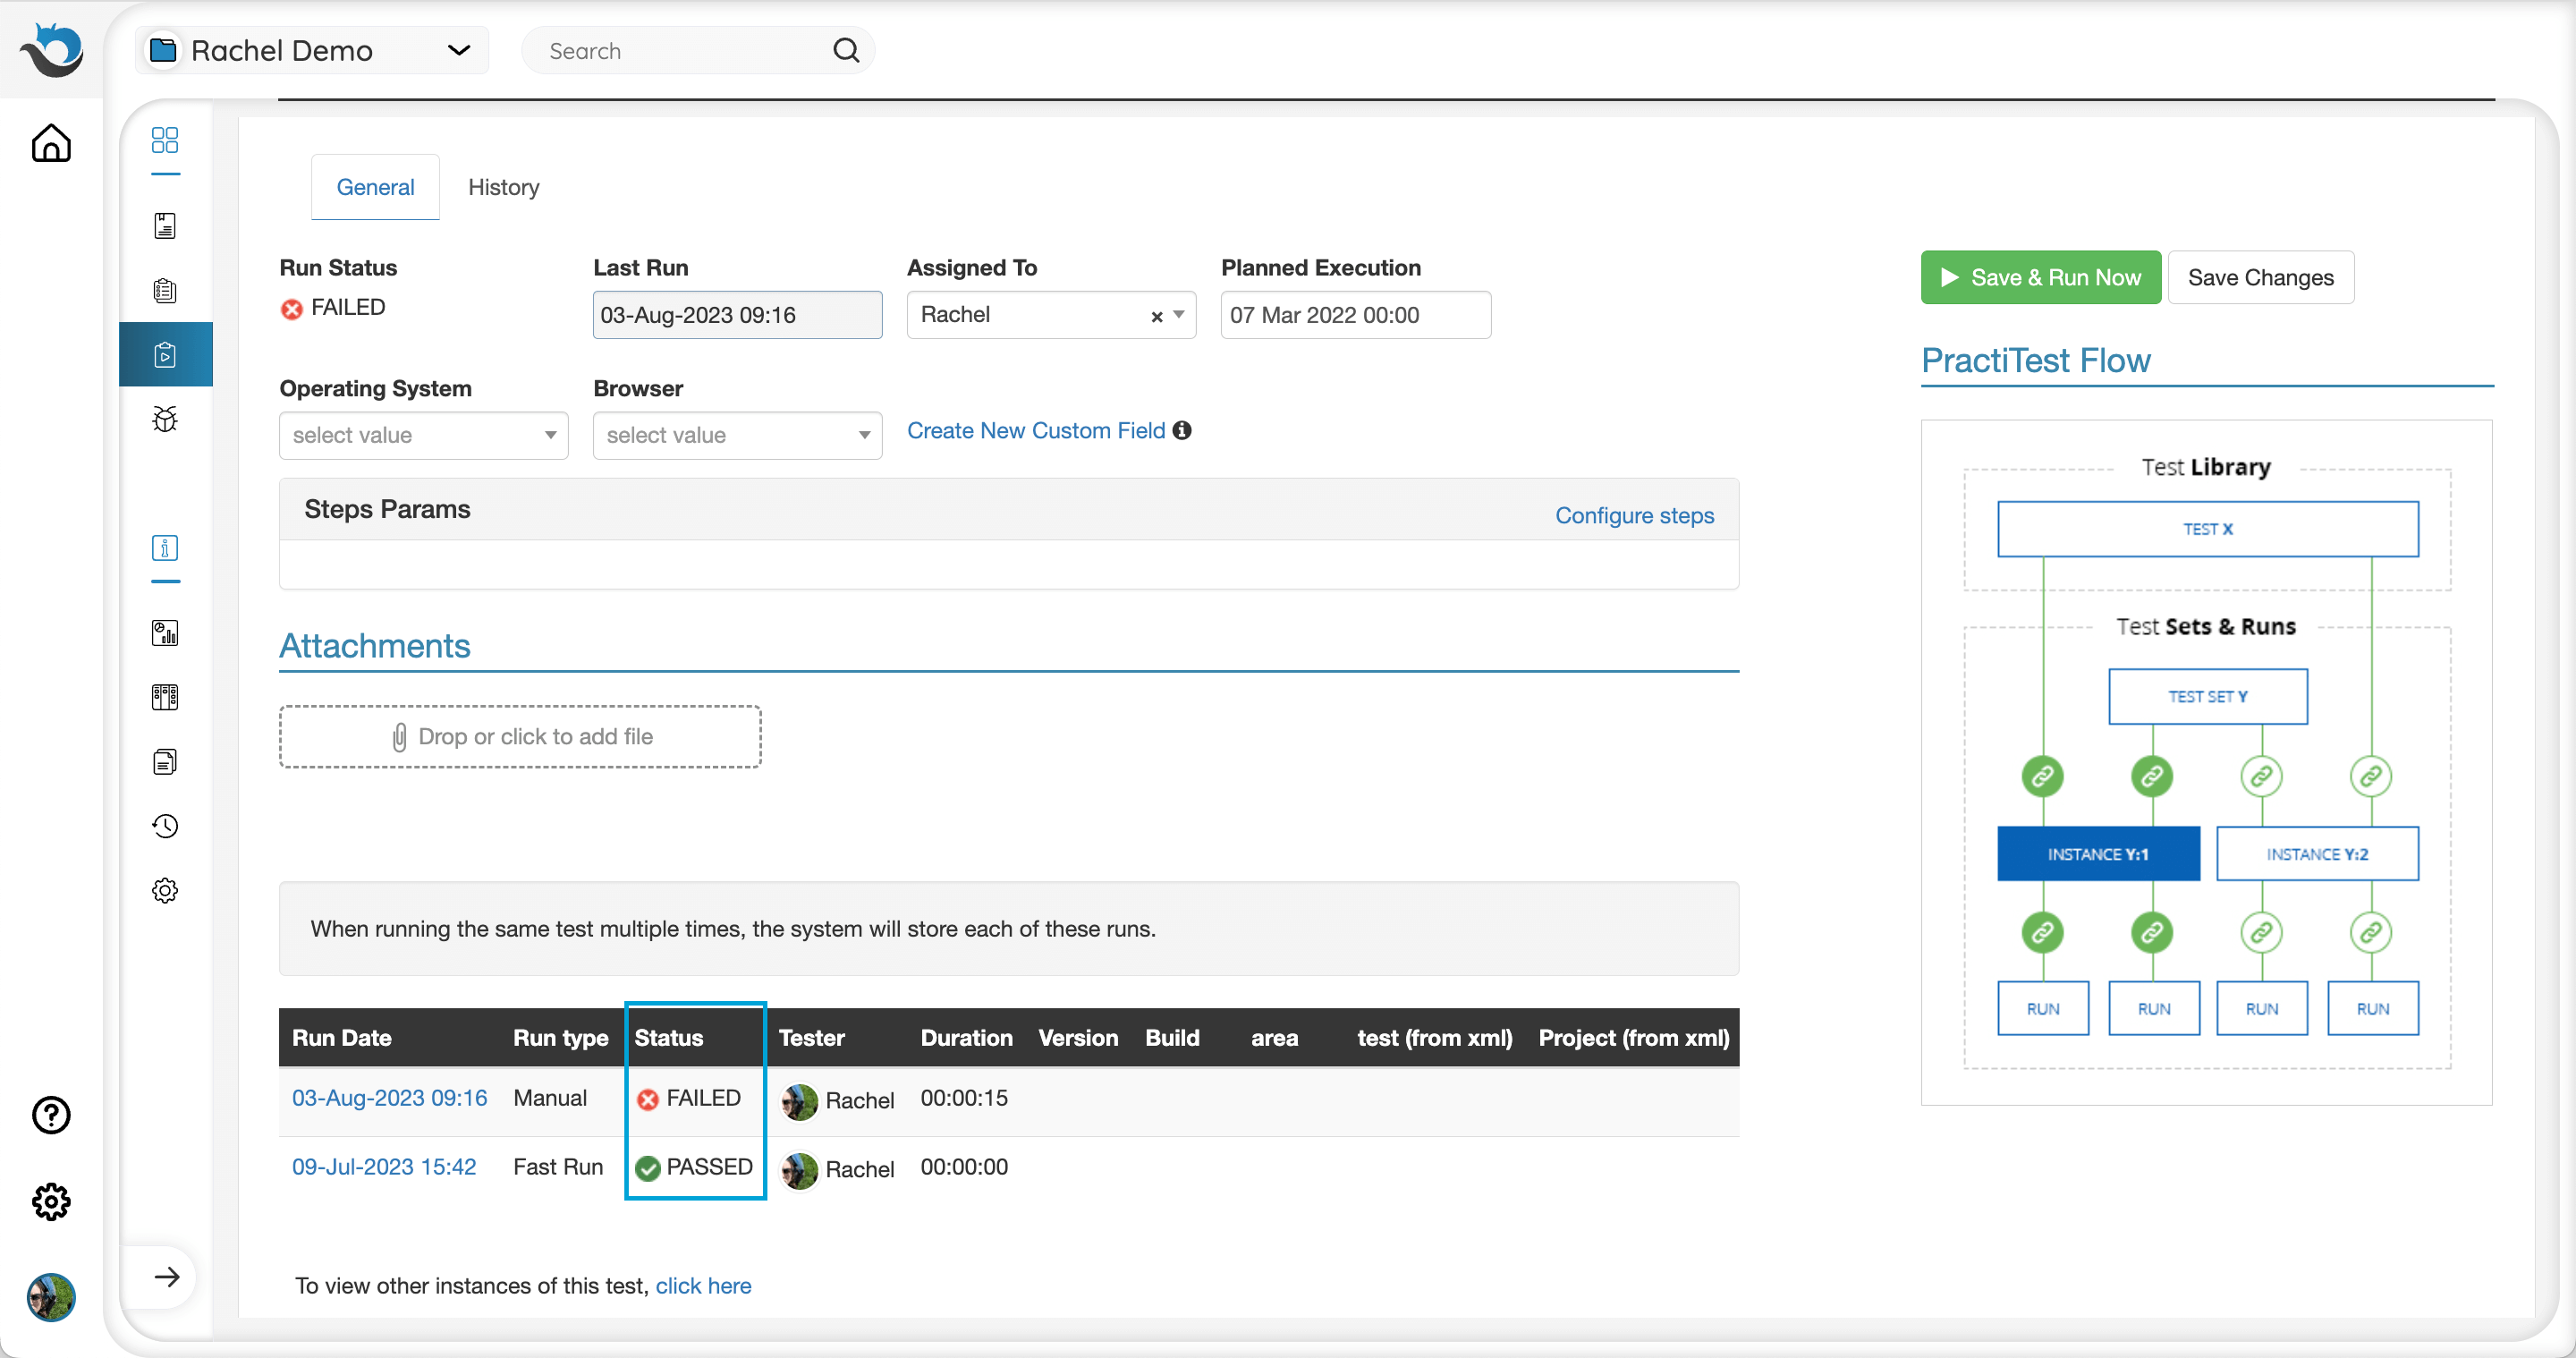
Run your Test Instances from the Instances tab. Each Test Instance can be run multiple times. You can view the results of previous runs by clicking on an instance’s name in the grid. The status displayed on the Test Set grid will be the status of the last run of each instance.
After determining the preferred default execution order for instances, you can change the actual execution order through sorting or filtering. Click the ‘Run’ button at the top right of the grid to start executing the instances according to the actual execution order appearing in the grid.
Run Scripted Manual Tests
-
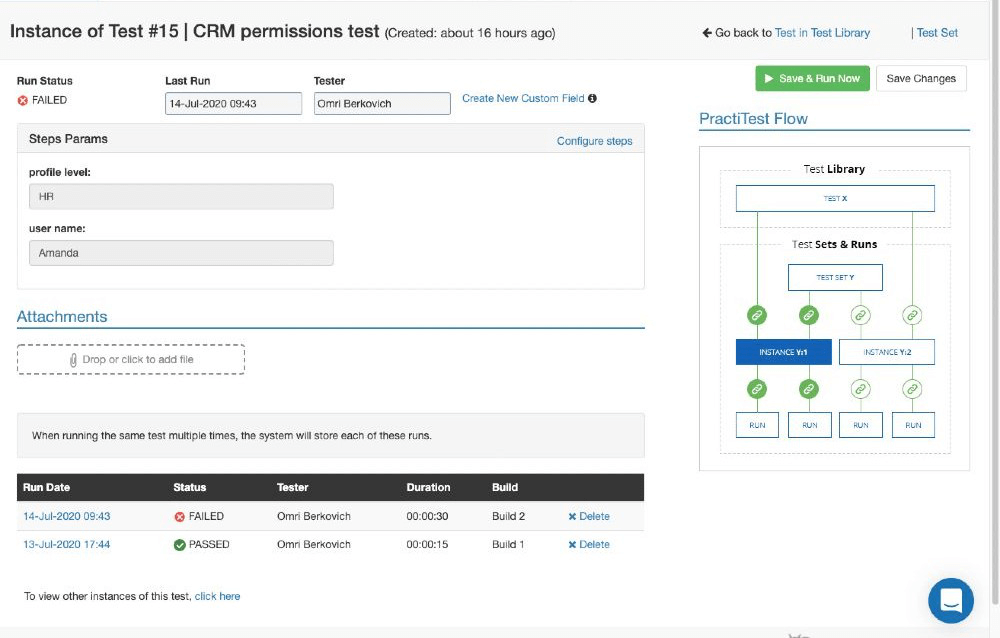
Clicking ‘Run’ on an instance with previous runs will open the instance window. In this window, you can view previous runs, view and define instance field values, and define parameters, if relevant. Click ‘Save & Run Now’ on the top-right side of the instance window.
- You have reached the “Run” page.
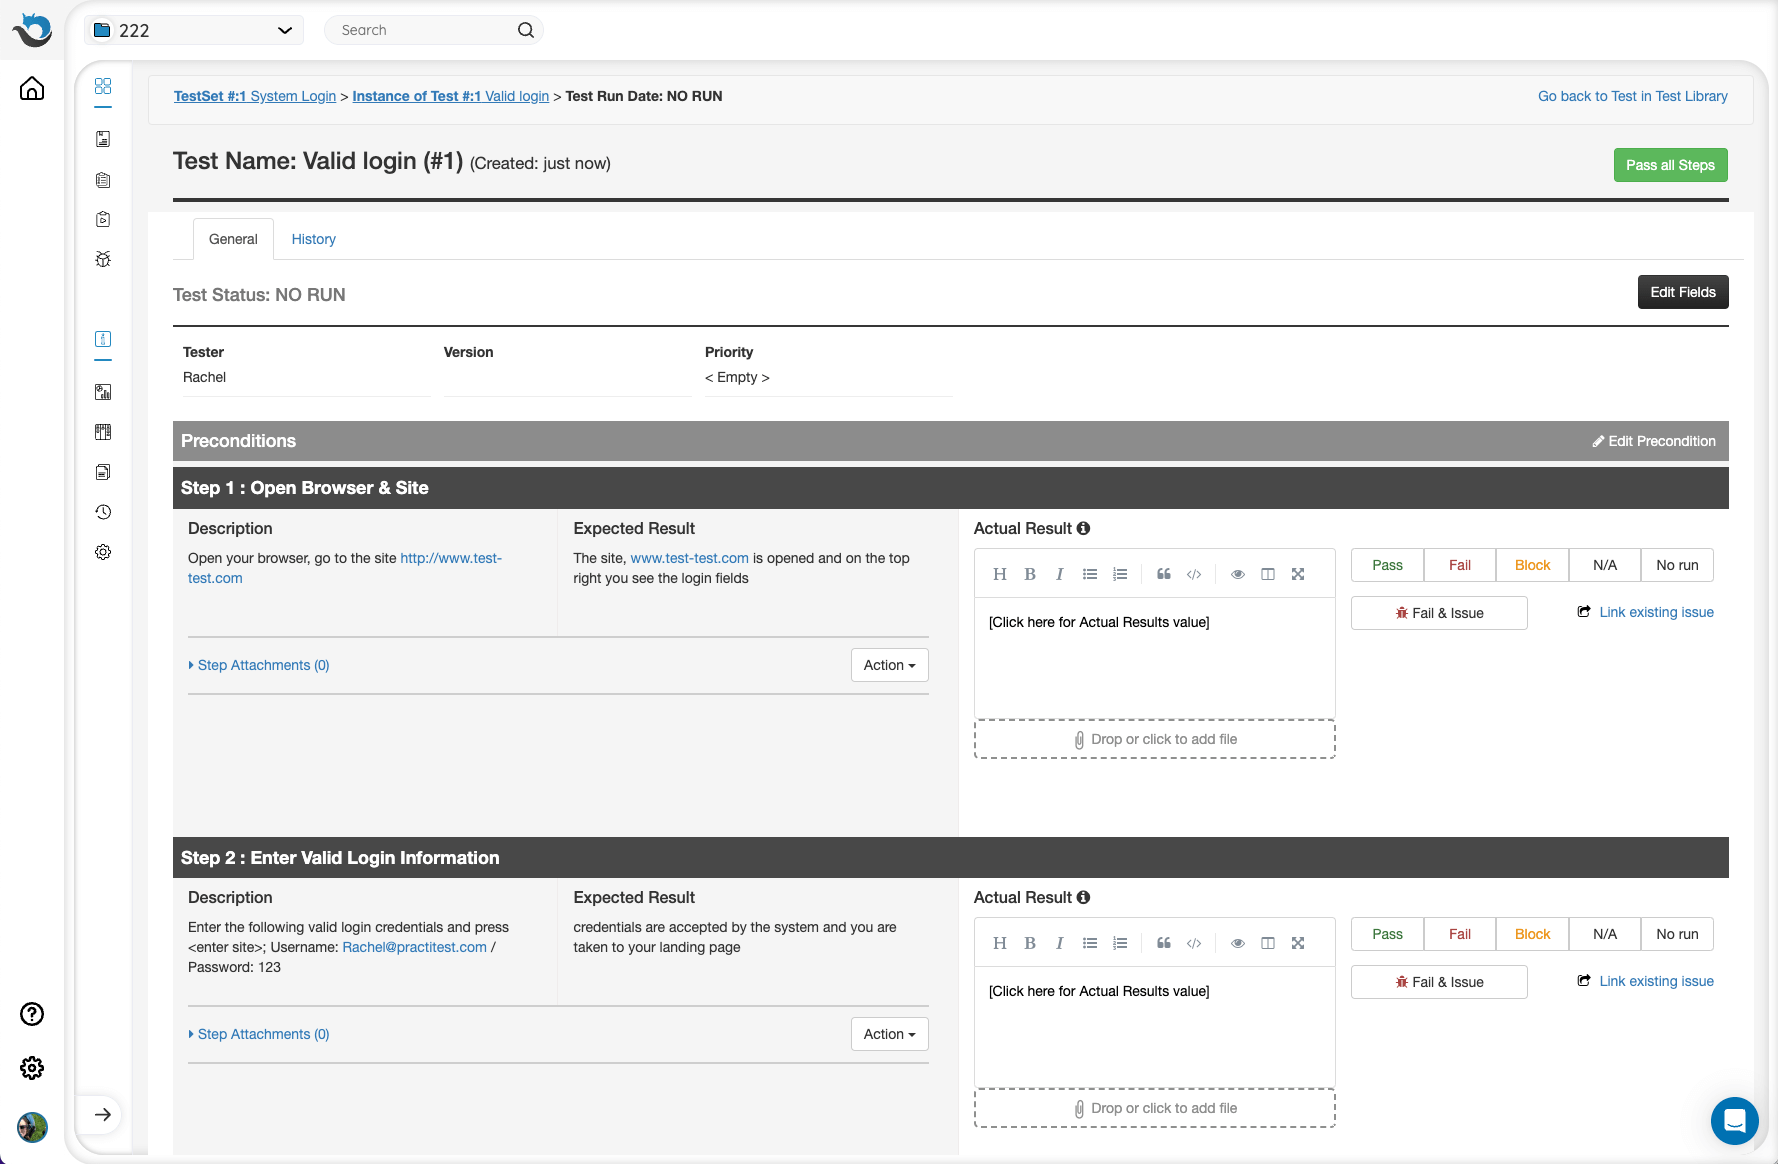 Now you can review each step of your Test and verify that the desired action can be executed. If a step is successful, click the ‘pass’ link to pass the step.
 - In case this action cannot be executed or if there is a bug in your application, set the corresponding step to FAIL. By clicking on the ‘Fail & Issue’ button, you will be able to automatically report a defect based on the steps already executed in your run, as well as link the newly reported issue to the run. If there is no integration set up, the Issue will be created in PractiTest’s Issues module and linked to the Test. If your project has 2-way integration with Jira or any other external tool, selecting ‘Fail & Issue’ will open a dialog pop-up to report a bug directly to the external tool according to your configuration. In this case, a matching synced issue will also be created in PractiTest to allow continuous synchronization.
- You can also link between a step and an existing issue by clicking the “Link existing issue” link, typing its ID number in the box and selecting the ‘link’ button.
Note: When one of the steps in the run is marked as Fail, then the Run Status will automatically be failed, as well. However, if you mark a step ‘N/A’ (Non Applicable), you will be able to complete the test run without failing the entire run.
Run a Test With Step Parameters
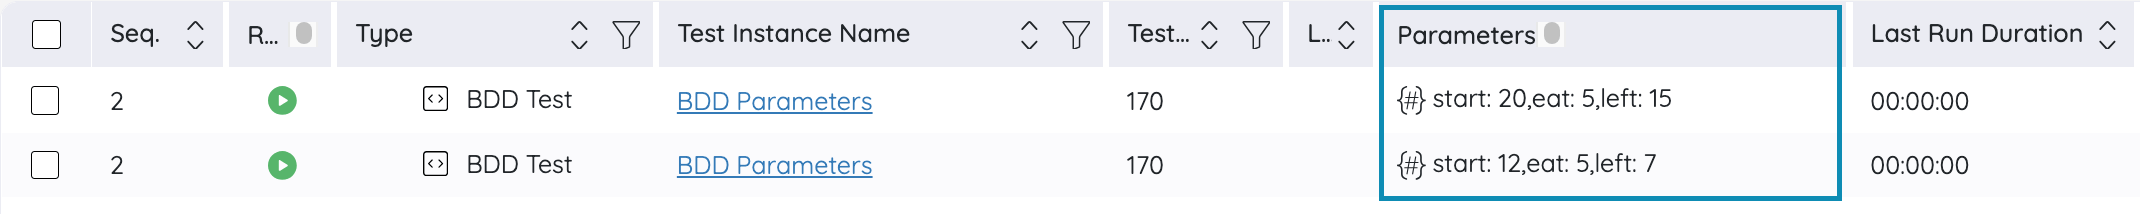
First, add the test with step parameters to an existing or new Test Set. Next, in the Test Set, tick the relevant test checkbox, and click on the three-dot on the top-right side of the Instances grid, and choose ‘Parameters’ from the pop-up window to define the first values of each parameter. You can add the ‘Parameters’ column to the instance grid to easily see which instances require defined parameters and view the values of already defined parameters without opening each instance individually.
Select each parameter in turn (check the box beside it) and manually enter its value. Click “Update Parameters” and run your test set.
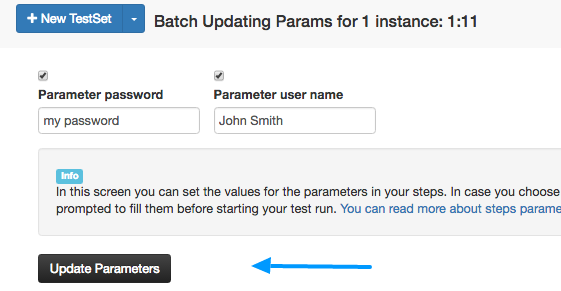
Note: If you set the parameter type to ‘list’ in the ‘Step parameters’ settings and added possible values to it, you will now see a drop-down list of values. The predefined values are not case-sensitive.
Configuring Step Parameters for a Specific Test Instance
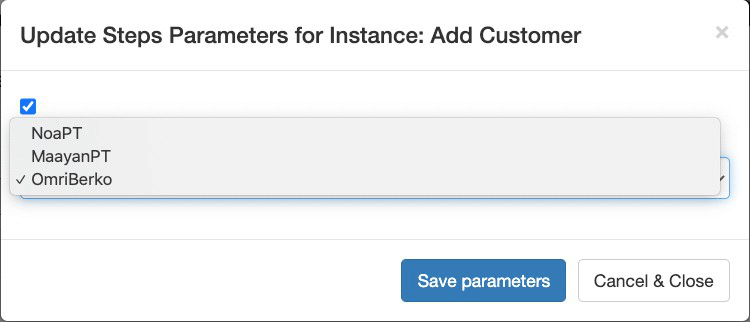
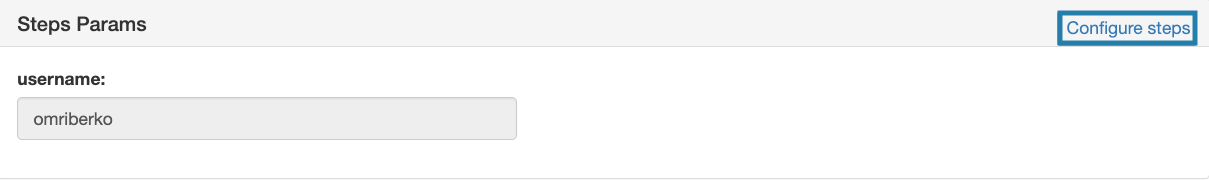
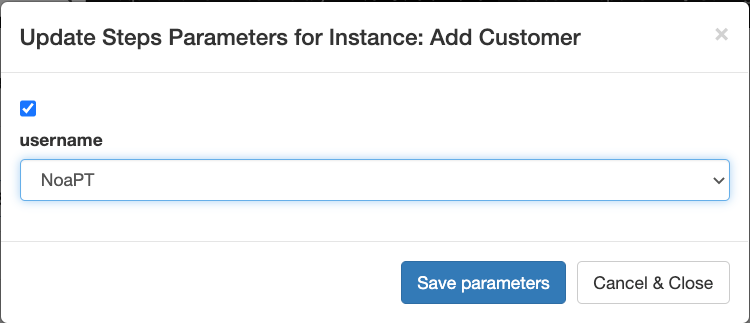
To update parameters and re-run the test, find the Test Instance and click on ‘Configure’ above the existing parameter display.
Update Steps Parameters for the Instance in the pop-up window and save. Re-run the test with the new set of parameters you’ve just added.
Run Called Tests
Call a Test allows you to reuse complete steps from an existing test to another one. To see the steps that you have copied to the new test , add your test to a Test Set and click ‘run’. You will now see all the steps of your test - including any other manually added steps - with full edit capabilities of the description, expected results fields, run status, bug reporting capabilities, and more.
Editing Called Steps
Deleting Steps While you are in the Test Run, you can delete any individual called step. However, while in the Test Library, deleting the called test will remove all the included steps from the new test.
Cloning Tests When cloning a Test in the Test Library that has “call a test” steps, the called test steps are cloned, as well, and include a link to the original test.
You can also clone a test with called steps to another project, where it will appear in that Test Library as a new test with all the step information.
Action Options in Test Run All editing capabilities of steps are available. However, you cannot add a new step in between called steps. You can add steps before or after by using the action button of the tests before and after the called step sequence.
Run an Exploratory Test
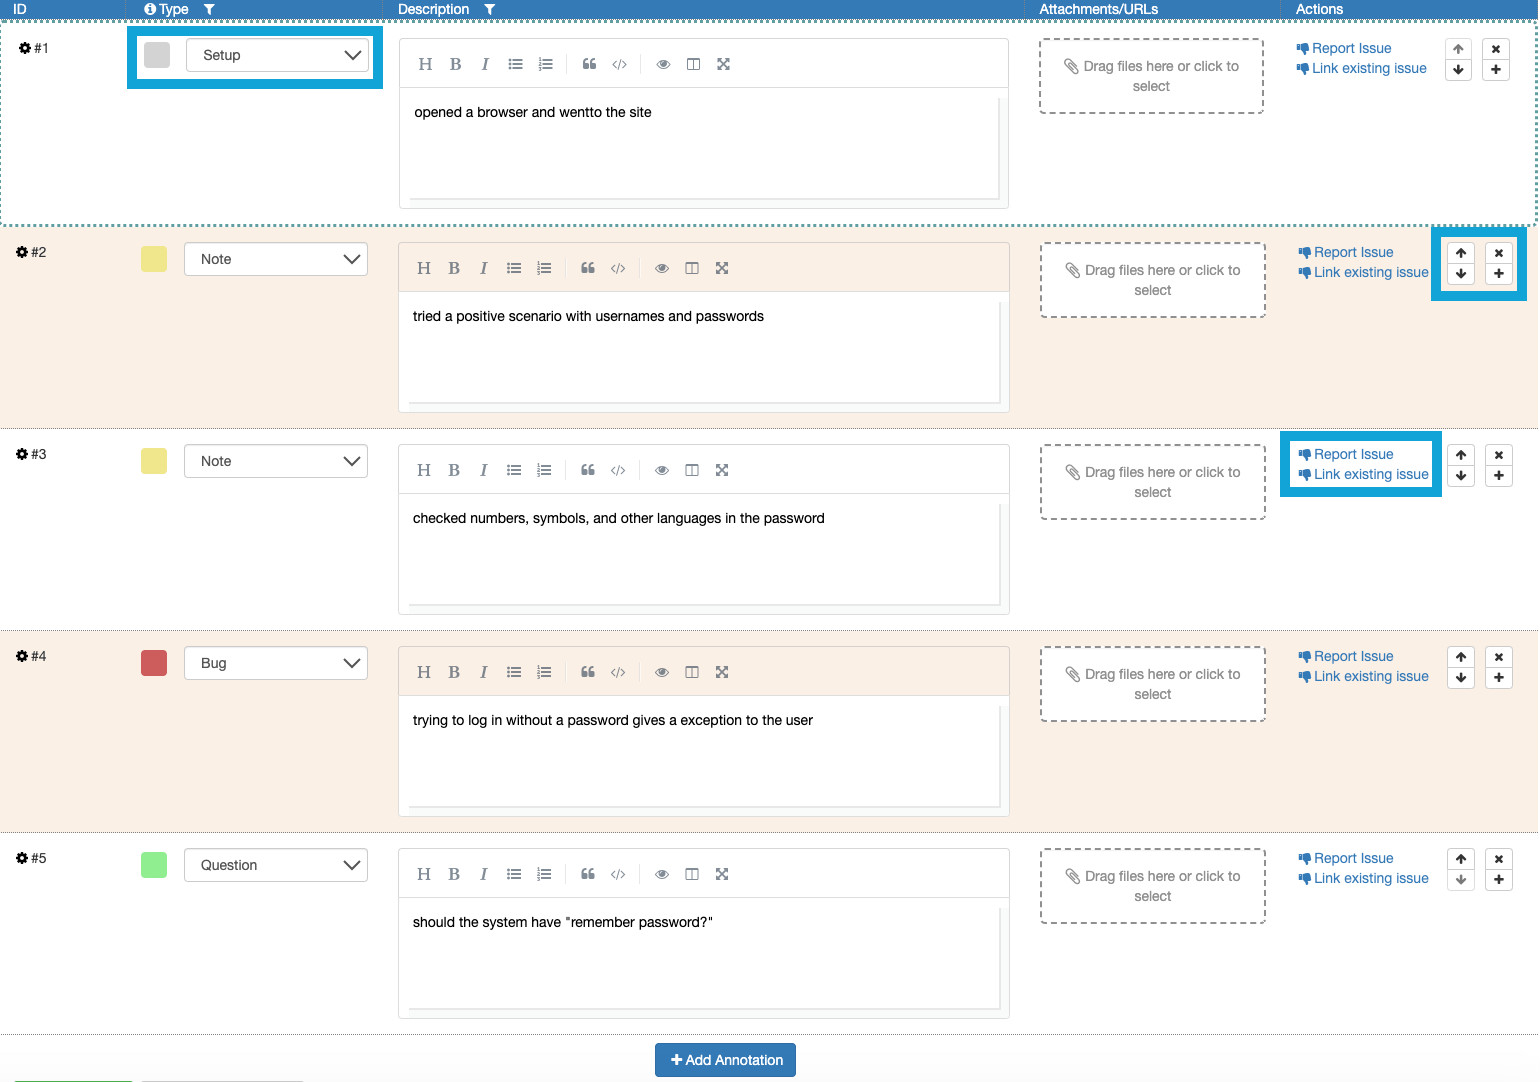
When running an Exploratory Test in the Exploratory Test Instance window, you can create annotations (parallel to regular test steps). Each annotation looks like a table row and can be deleted or re-ordered using the control buttons on the right. Since it is a session-based testing, each Exploratory Test can only run once.
The headers of the rows are:
- Type: Setup, Note, Bug, Question, Test, Concern
- Description: unlimited text field
- Attachments / URL: if you want to attach a screenshot or other image/reference
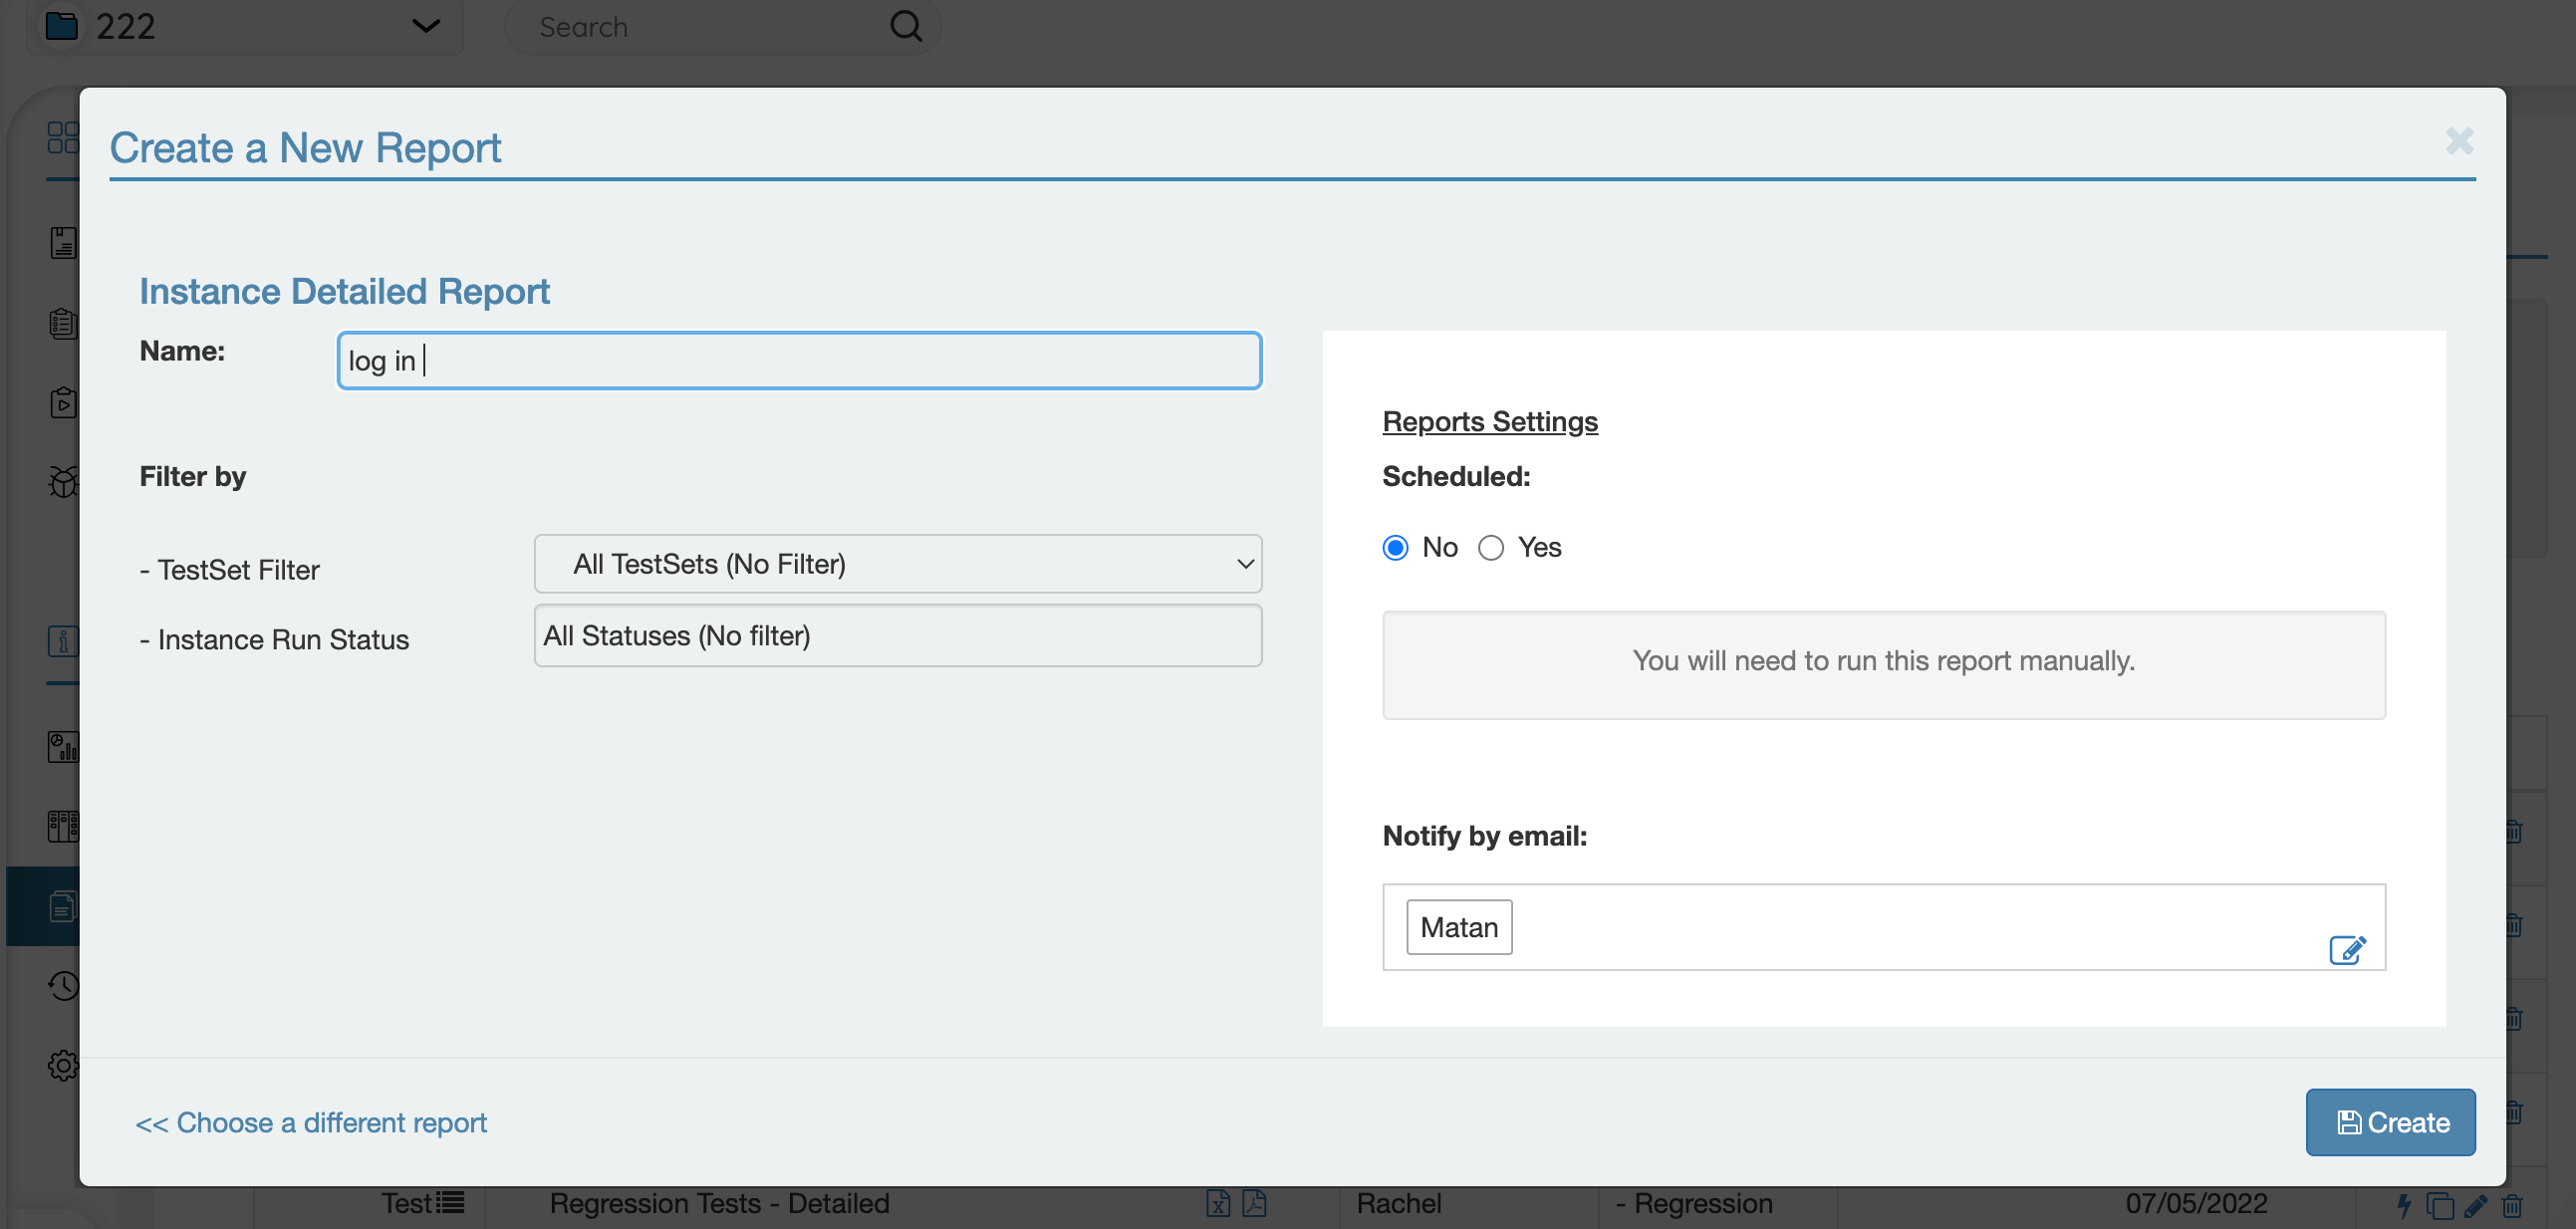
Note: Annotation types can be customized. If you want to generate a report that includes you Exploratory Test annotations, please create an “Instance Detailed” report.
Report an Issue from ET
If you encounter a new issue, you can report it by selecting the ‘Report Issue’ button under the Actions column.
This works similarly to the ‘Fail & Issue’ link within Manual Scripted test runs. The window that will open depends on your project integrations. For instance, if your project has 2-way integration with Jira, selecting ‘Report Issue’ will open your Jira account with the ‘report a bug’ option. If there is no integration set up, the Issue will be created in PractiTest’s Issues module and linked to the Test.
If you encounter an issue that already exists in your Issues module or external bug tracker, click the ‘Link Existing Issue’ button under the Actions column and fill in the Issue ID.
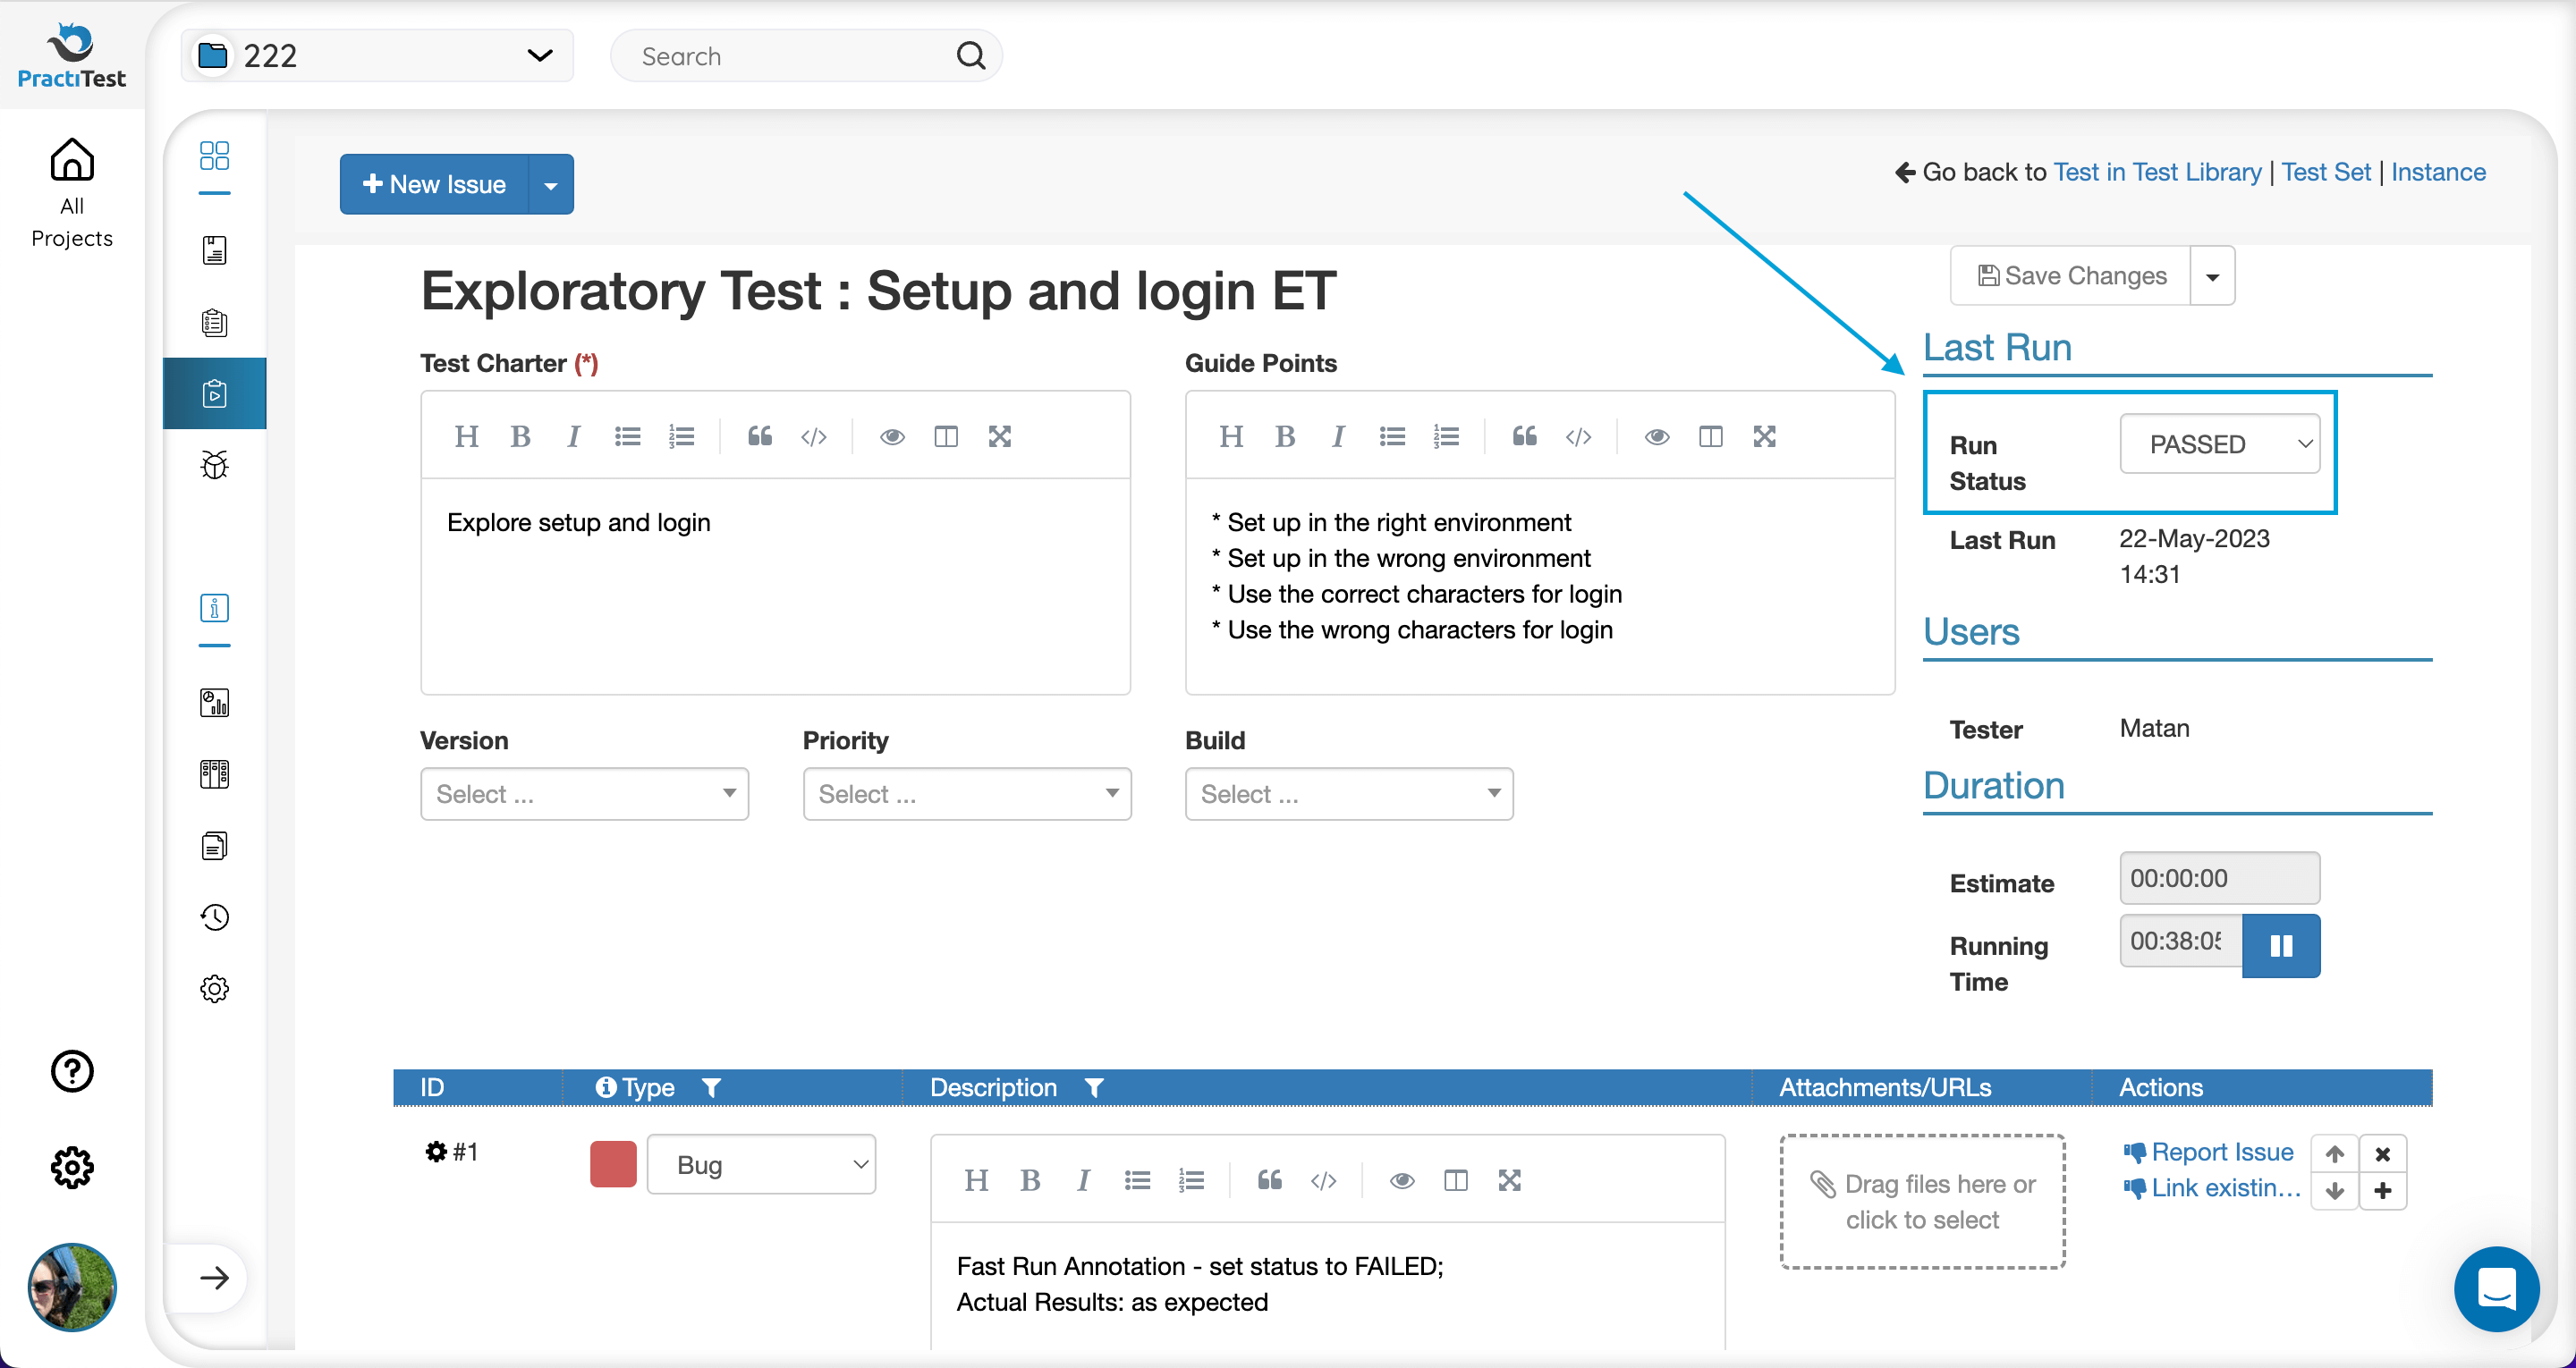
At the end of your session, set the Run Status to the correct status. The status is defaulted to “No Run” when the Exploratory Test instance is added to the Test Set and saved.
Run a BDD Test
Note:
- Unlike other test types, when a BDD test is edited, test instances that were added to Test Sets prior to this edit will not be changed accordingly.
- Find and Replace is currently not supported for the Scenario field.
In order to run a BDD test, add it to a Test Set. If you add a simple ‘Scenario’ type BDD test, the test will be added as an instance similar to other tests.
If you add a ‘Scenario Outline’ type BDD test, PractiTest will automatically create multiple instances for each Example row in the Scenario Outline. The examples will appear as parameters in the parameters column of the instances grid. Unlike parameters, the examples cannot be edited from the Test Set and the value is static according to the examples in the test.
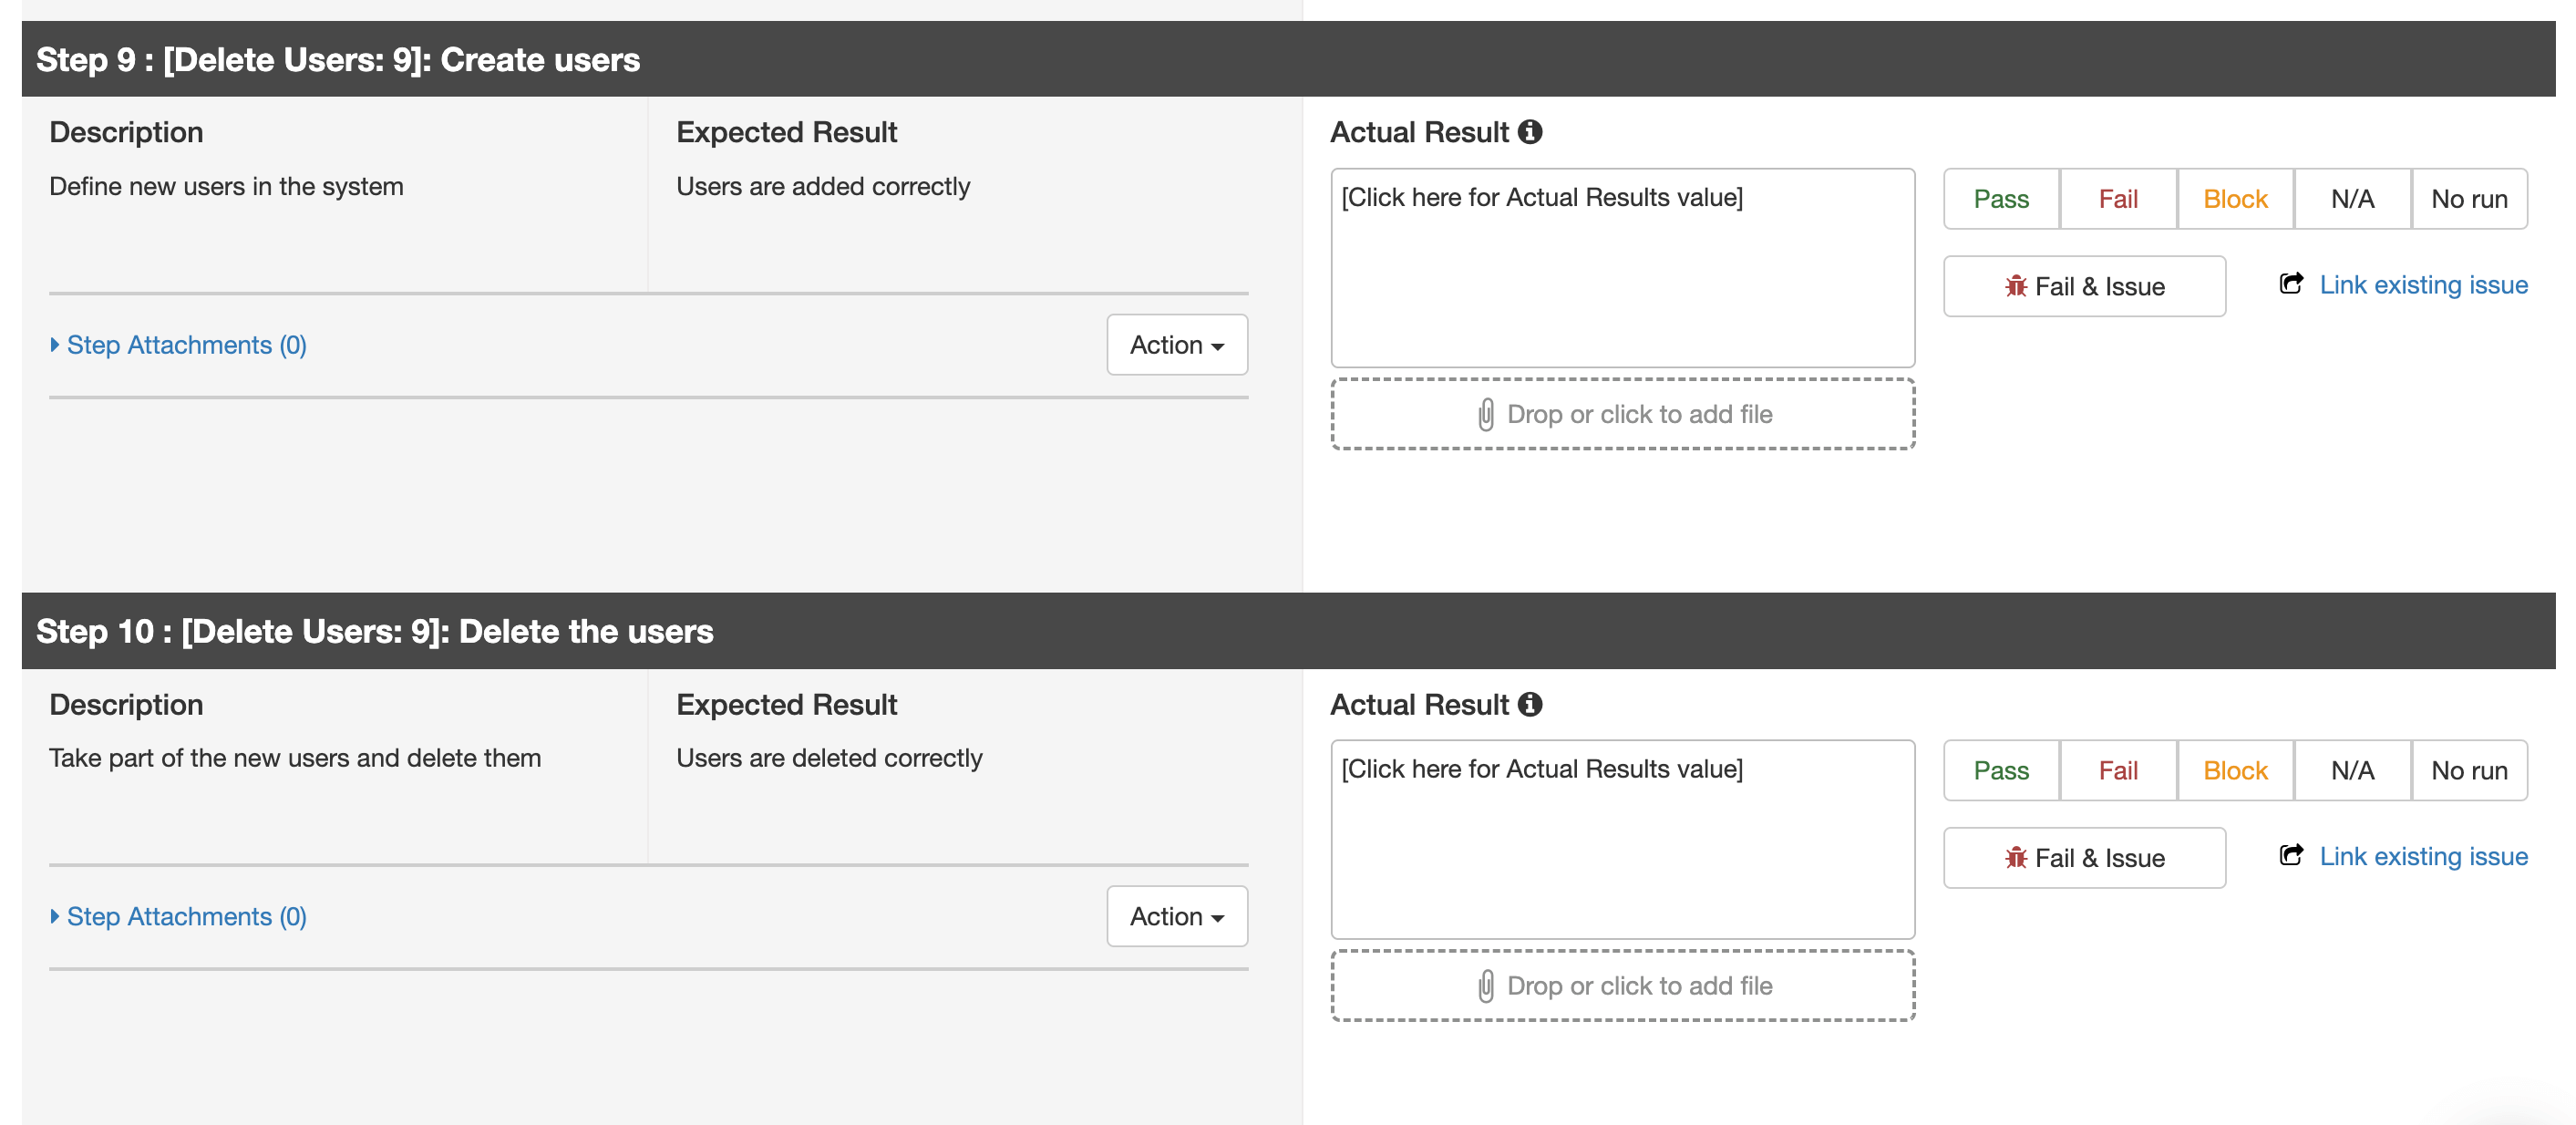
When you run the instance, each row in the original test will become a step in the test run, and the Gherkin word that starts the row will appear as the step name:
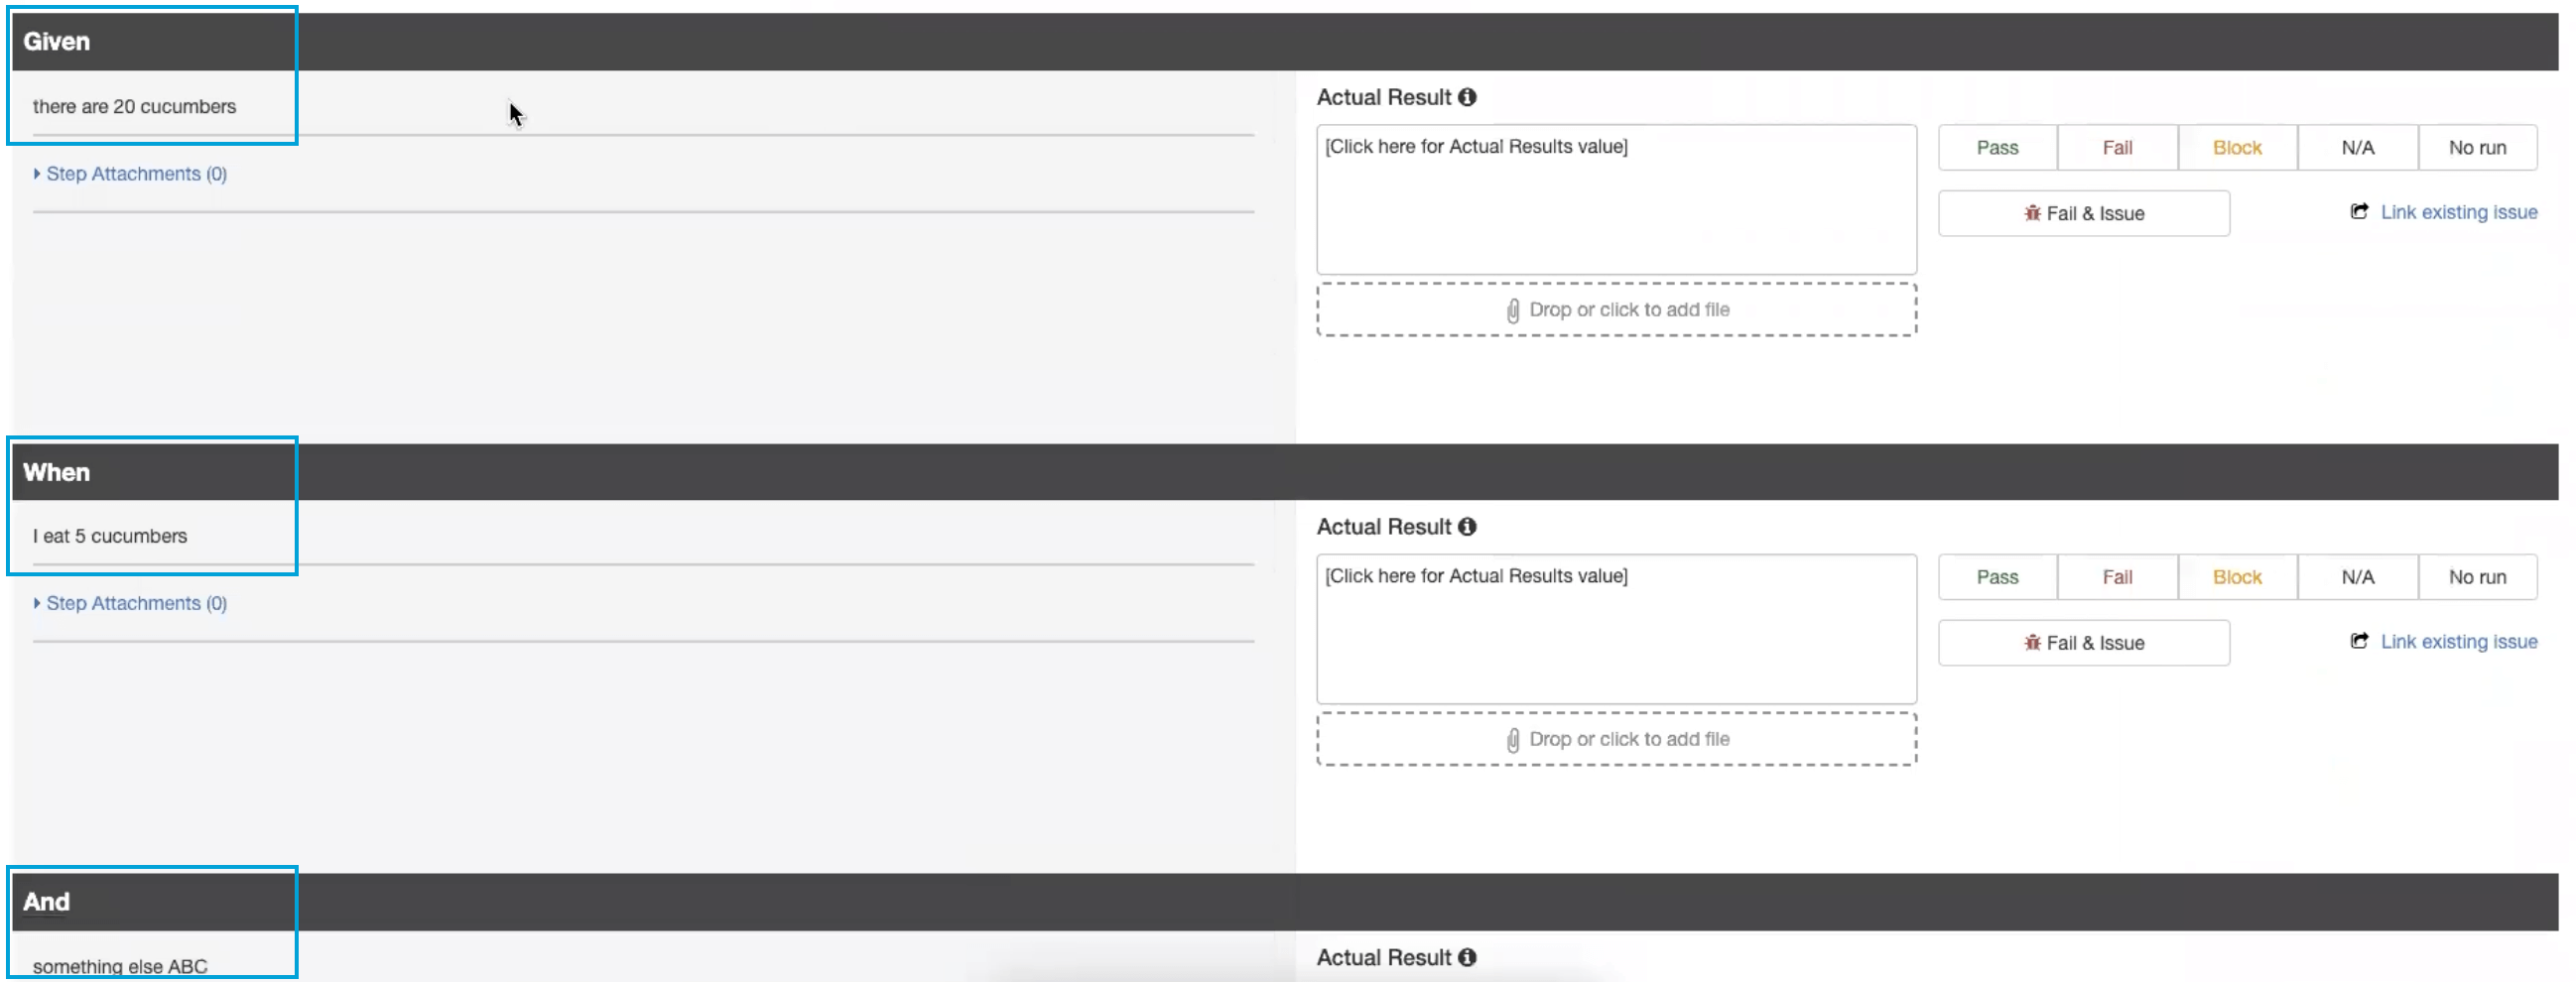
Like manual tests, you can add results and attachments, set a status, report or link an issue for each step. Unlike manual tests, the test cannot be edited from the run and actions are unavailable.
Report Automated BDD Test Results to PractiTest
Use the PractiTest REST API to create or update BDD tests and their Test Set run results.
Run and Report Automated Tests
There are a few ways to run automation with PractiTest. You can read about them here.
Fast Run
Fast Run is a quick and easy one-step option to run your tests without needing to update each step separately.
- Go to the ‘Test Sets & Runs’ tab, enter the required Test Set, and select the relevant test instances.
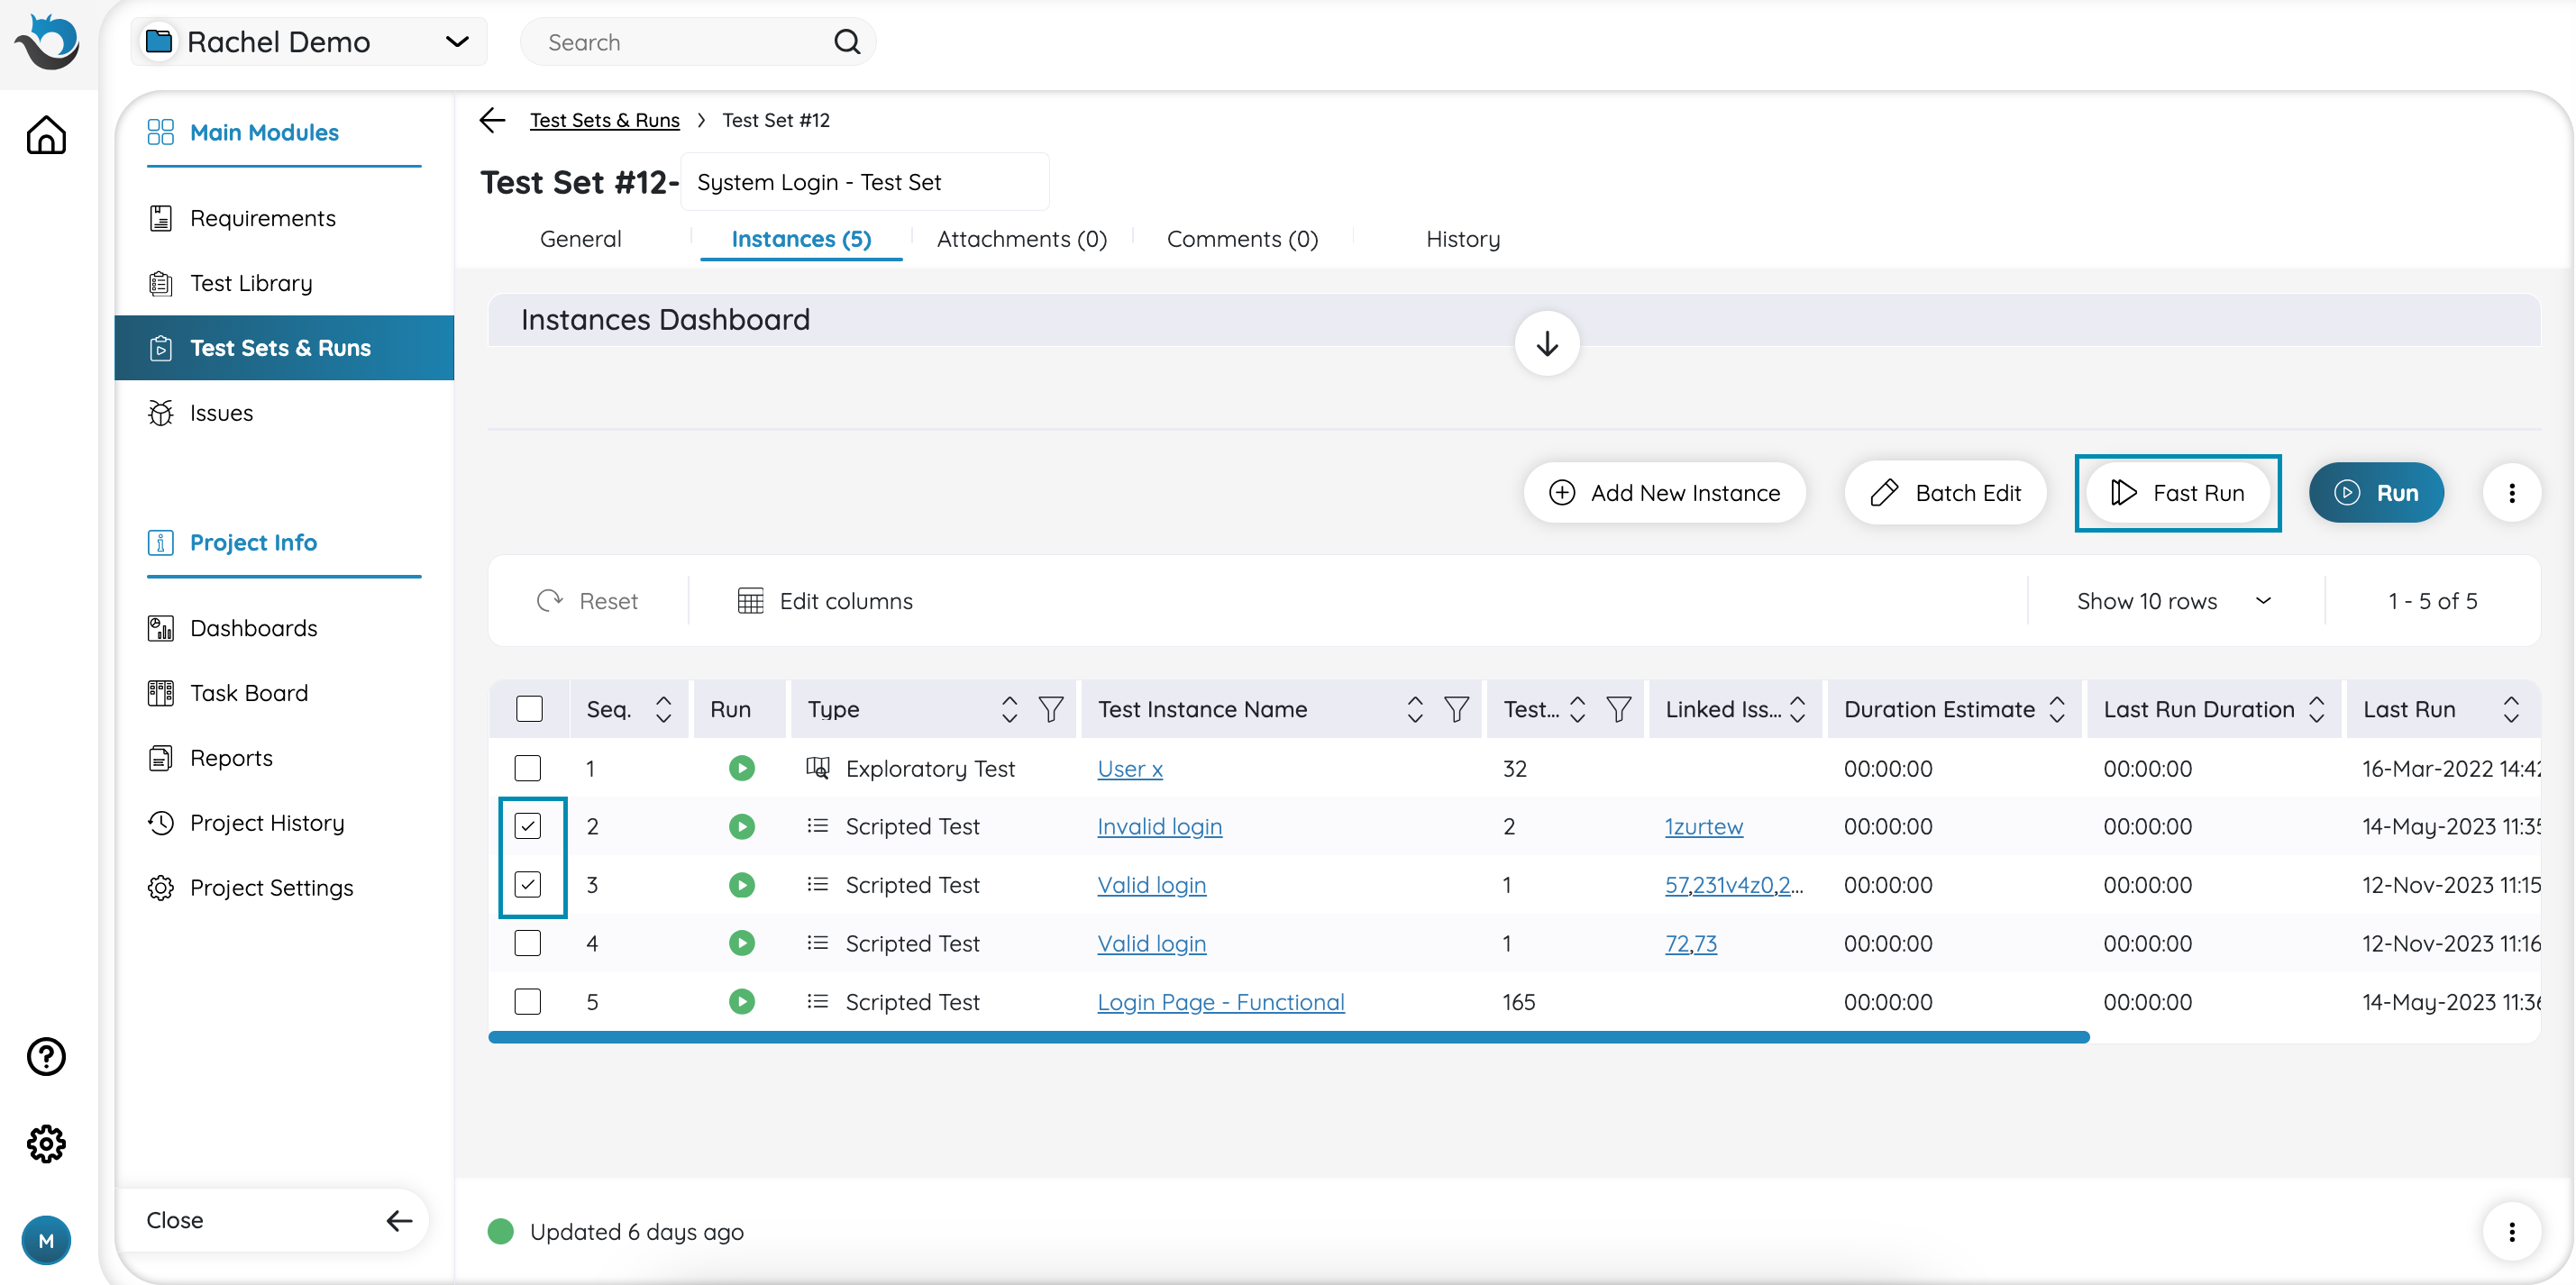
- Select the “Fast Run” link on the top-right hand side of the Instance Grid. This will take you to the Fast Run screen.
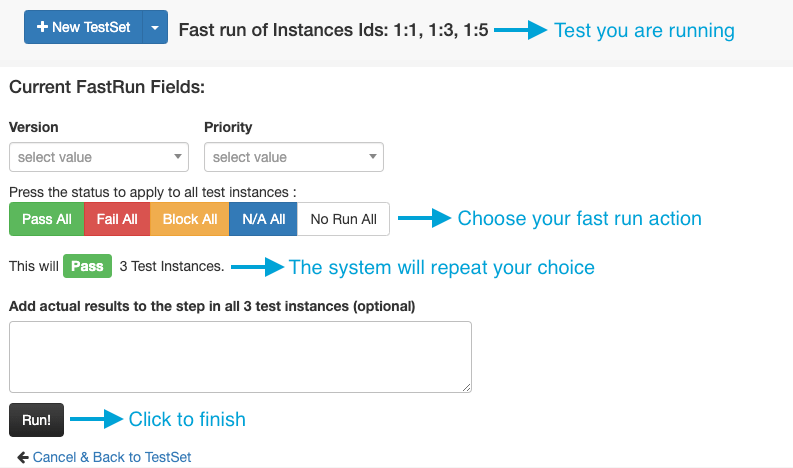
- Choose one of these four options: “Pass All”, “Fail All”, “Block All”, or “No Run All”. The system will confirm your selection, ie. “This will Fail 4 Test Instances.”
- To finish the fast run, select Run or you can cancel to return to the previous screen.
Note: You can disable the “Fast Run” option by unchecking its box in the Project Settings.
Fast Run Results
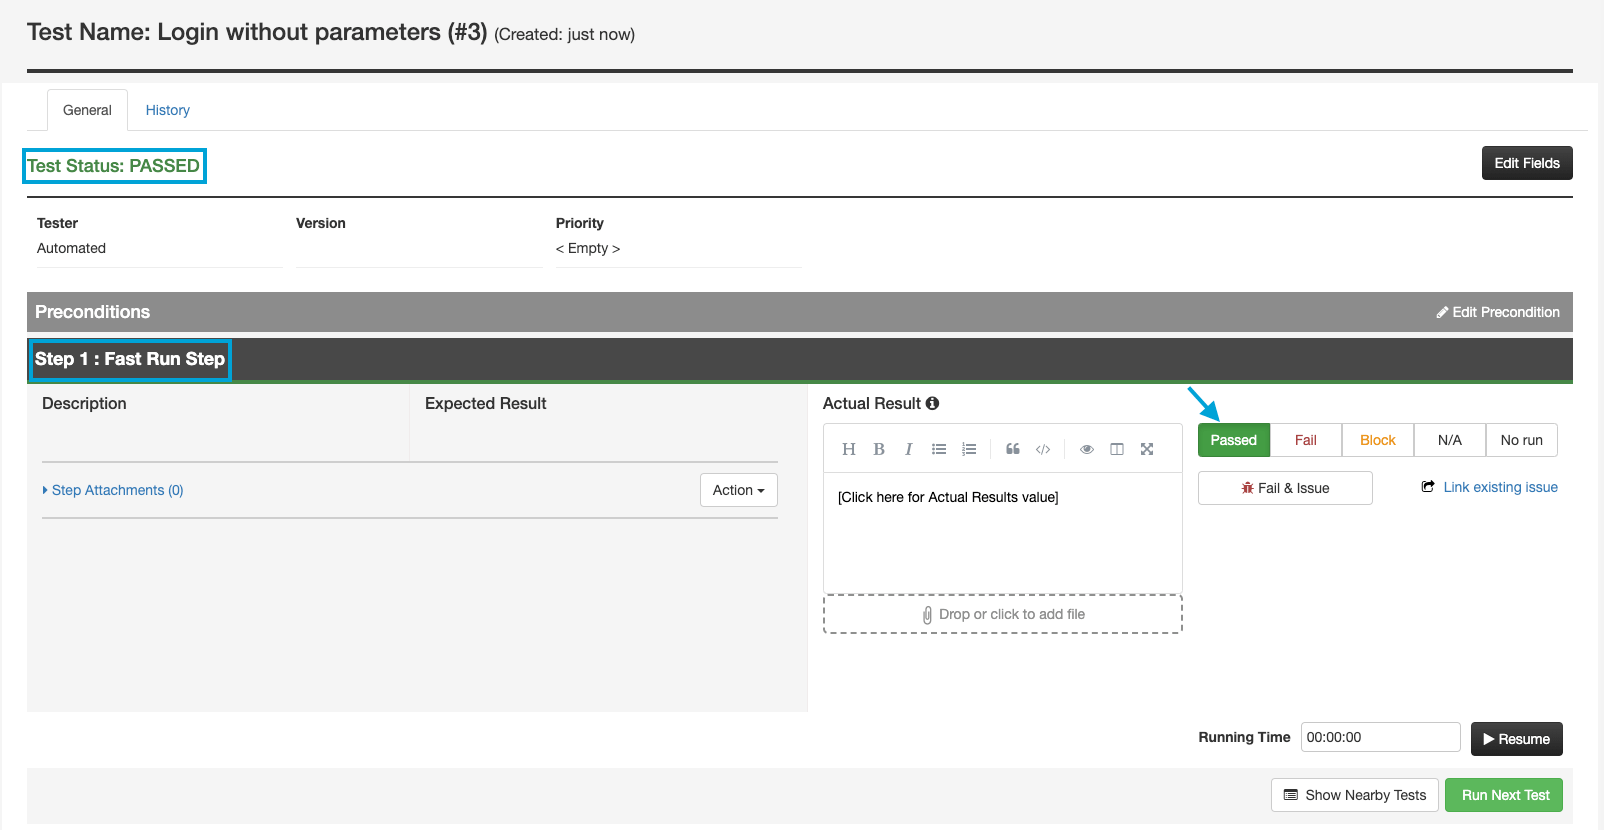
The selected tests will be set to Pass/Fail/Block/NoRun status according to your choice.
Note that if you go to the test run and to the run steps, you won’t find the usual test steps. Instead, you will only see one step defined as “Step 1: Fast Run Step”.
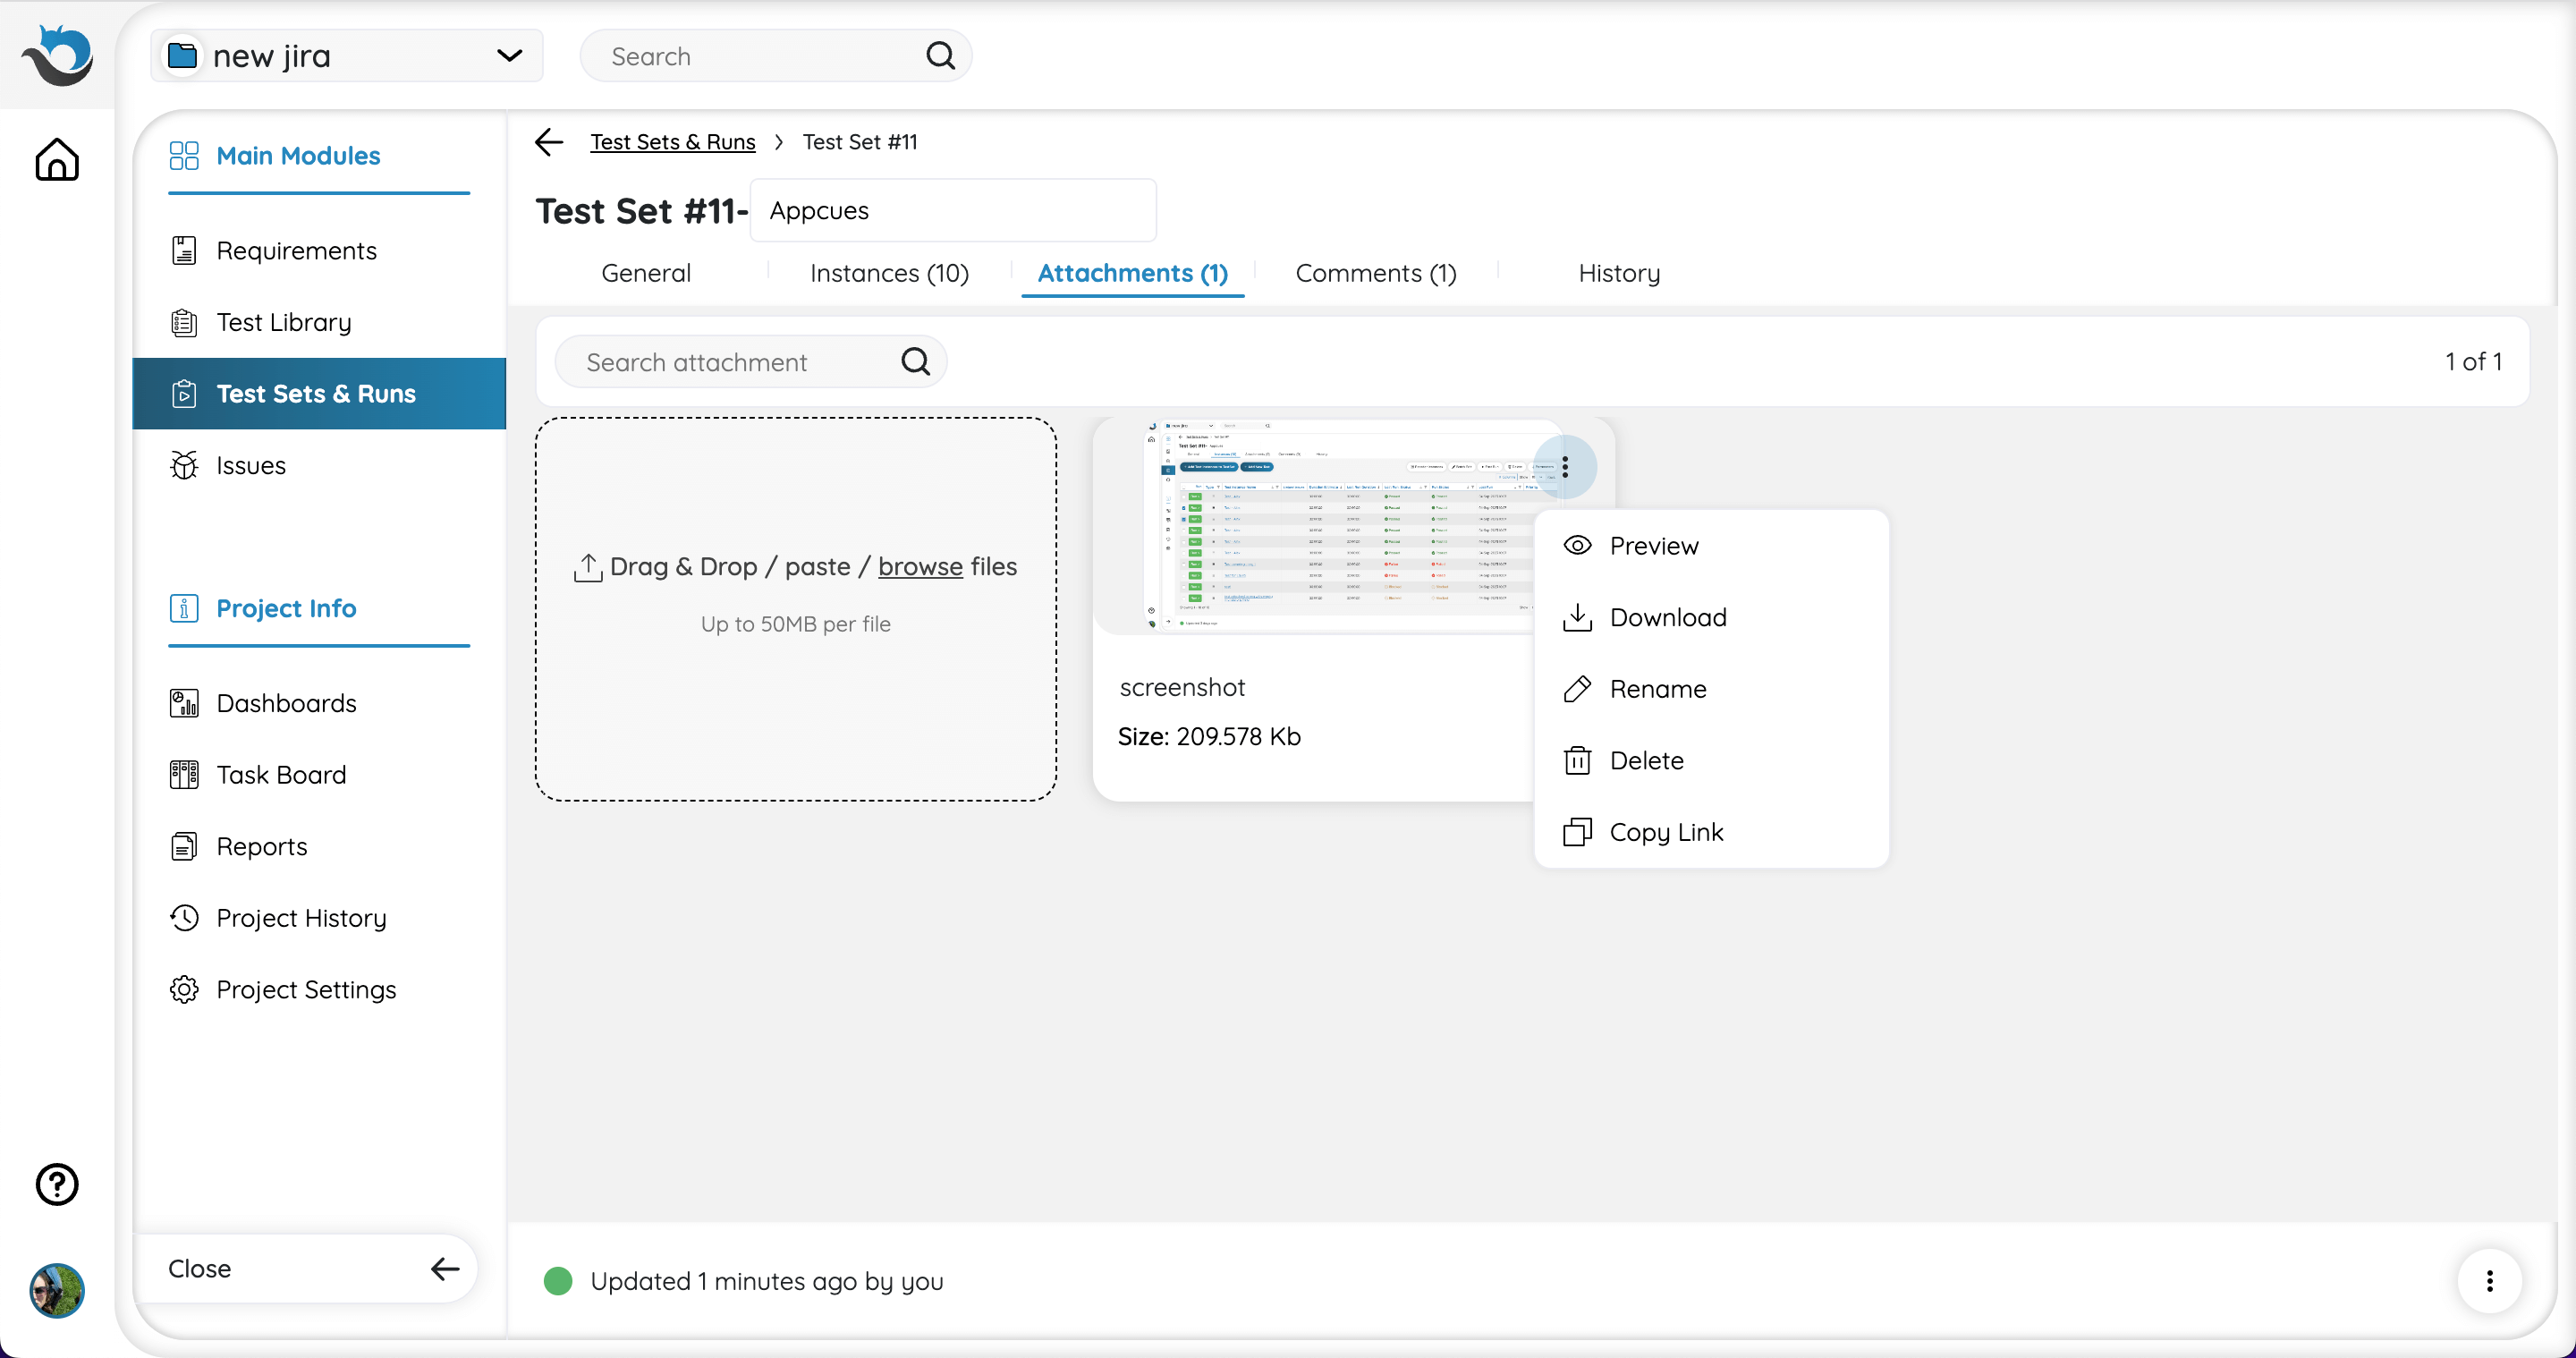
Attachments
Use this tab to add, preview, download, rename, delete, and and copy the links of your attachments and paste them into the description in the General tab. You can also add attachments to the entity by dragging and dropping them into the description field. Once added, the attachments will automatically appear in the Attachments tab.
Note: Test Set attachments refer to the entire Test Set. When running tests in the Test Set, attachments can be added to each test run step, or in the case of exploratory tests (ET), attachments can be added to each annotation. Read more about the difference between test attachments here.
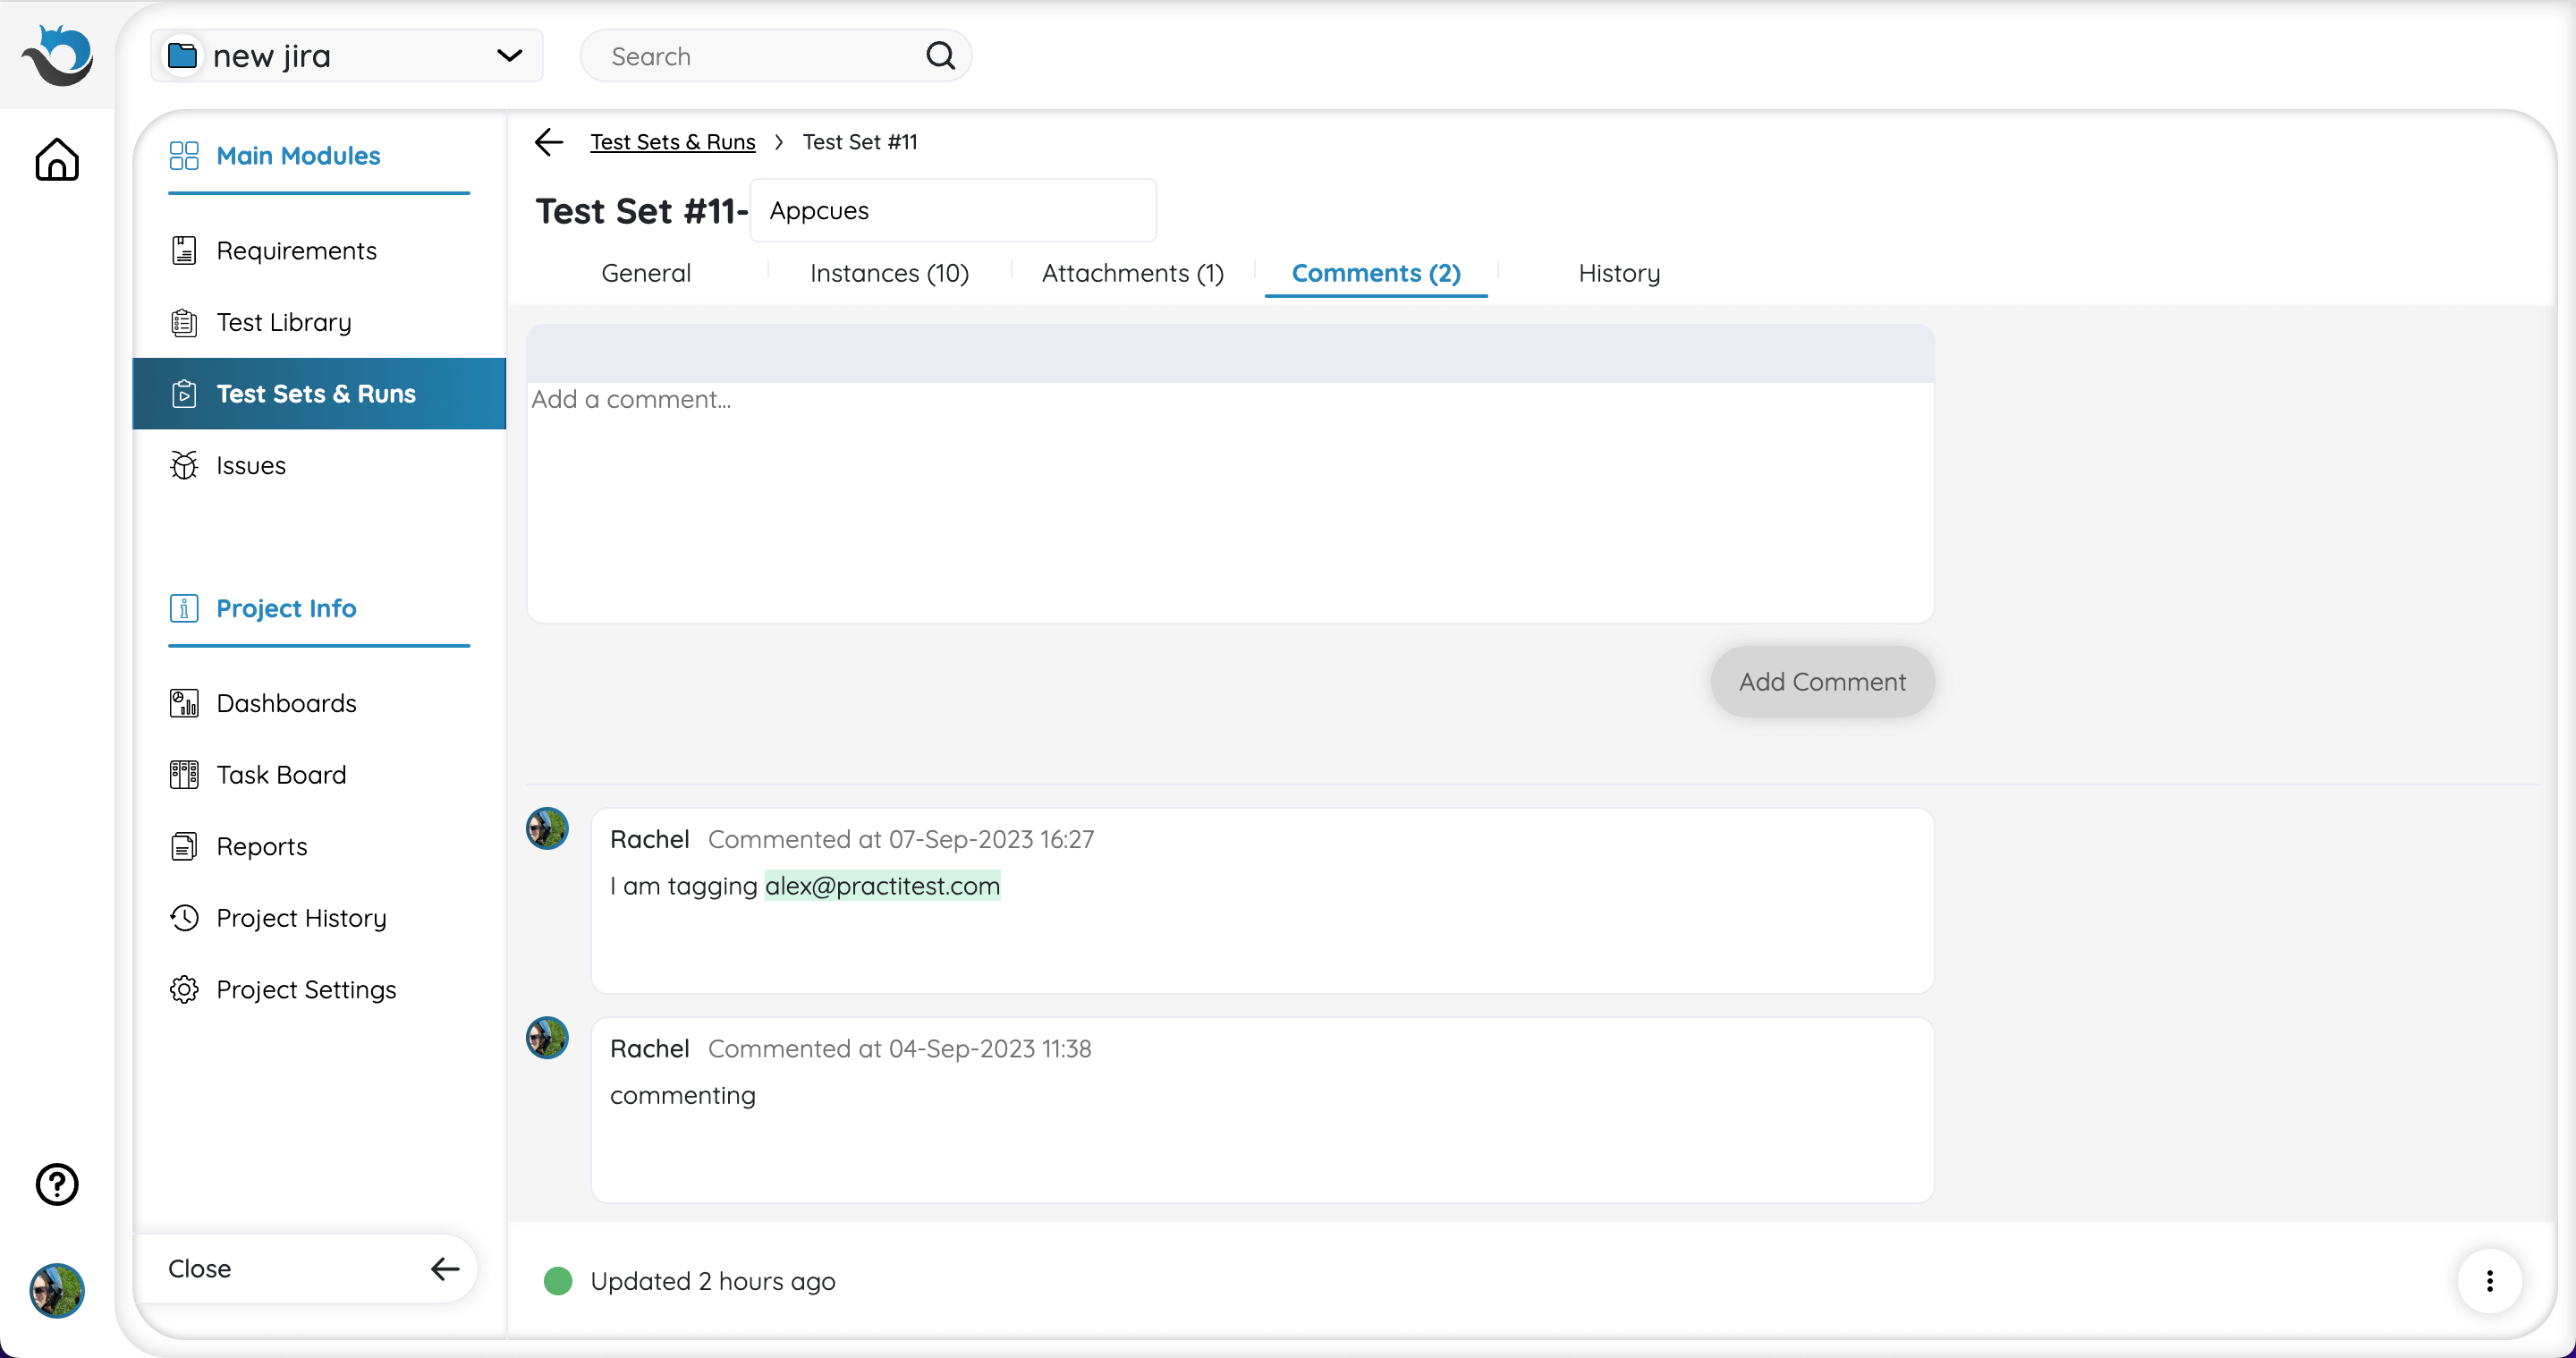
Comments
Add and edit comments regarding the Test Set in this tab. You can also tag another user using the ‘@’ tag and then typing his/her username.
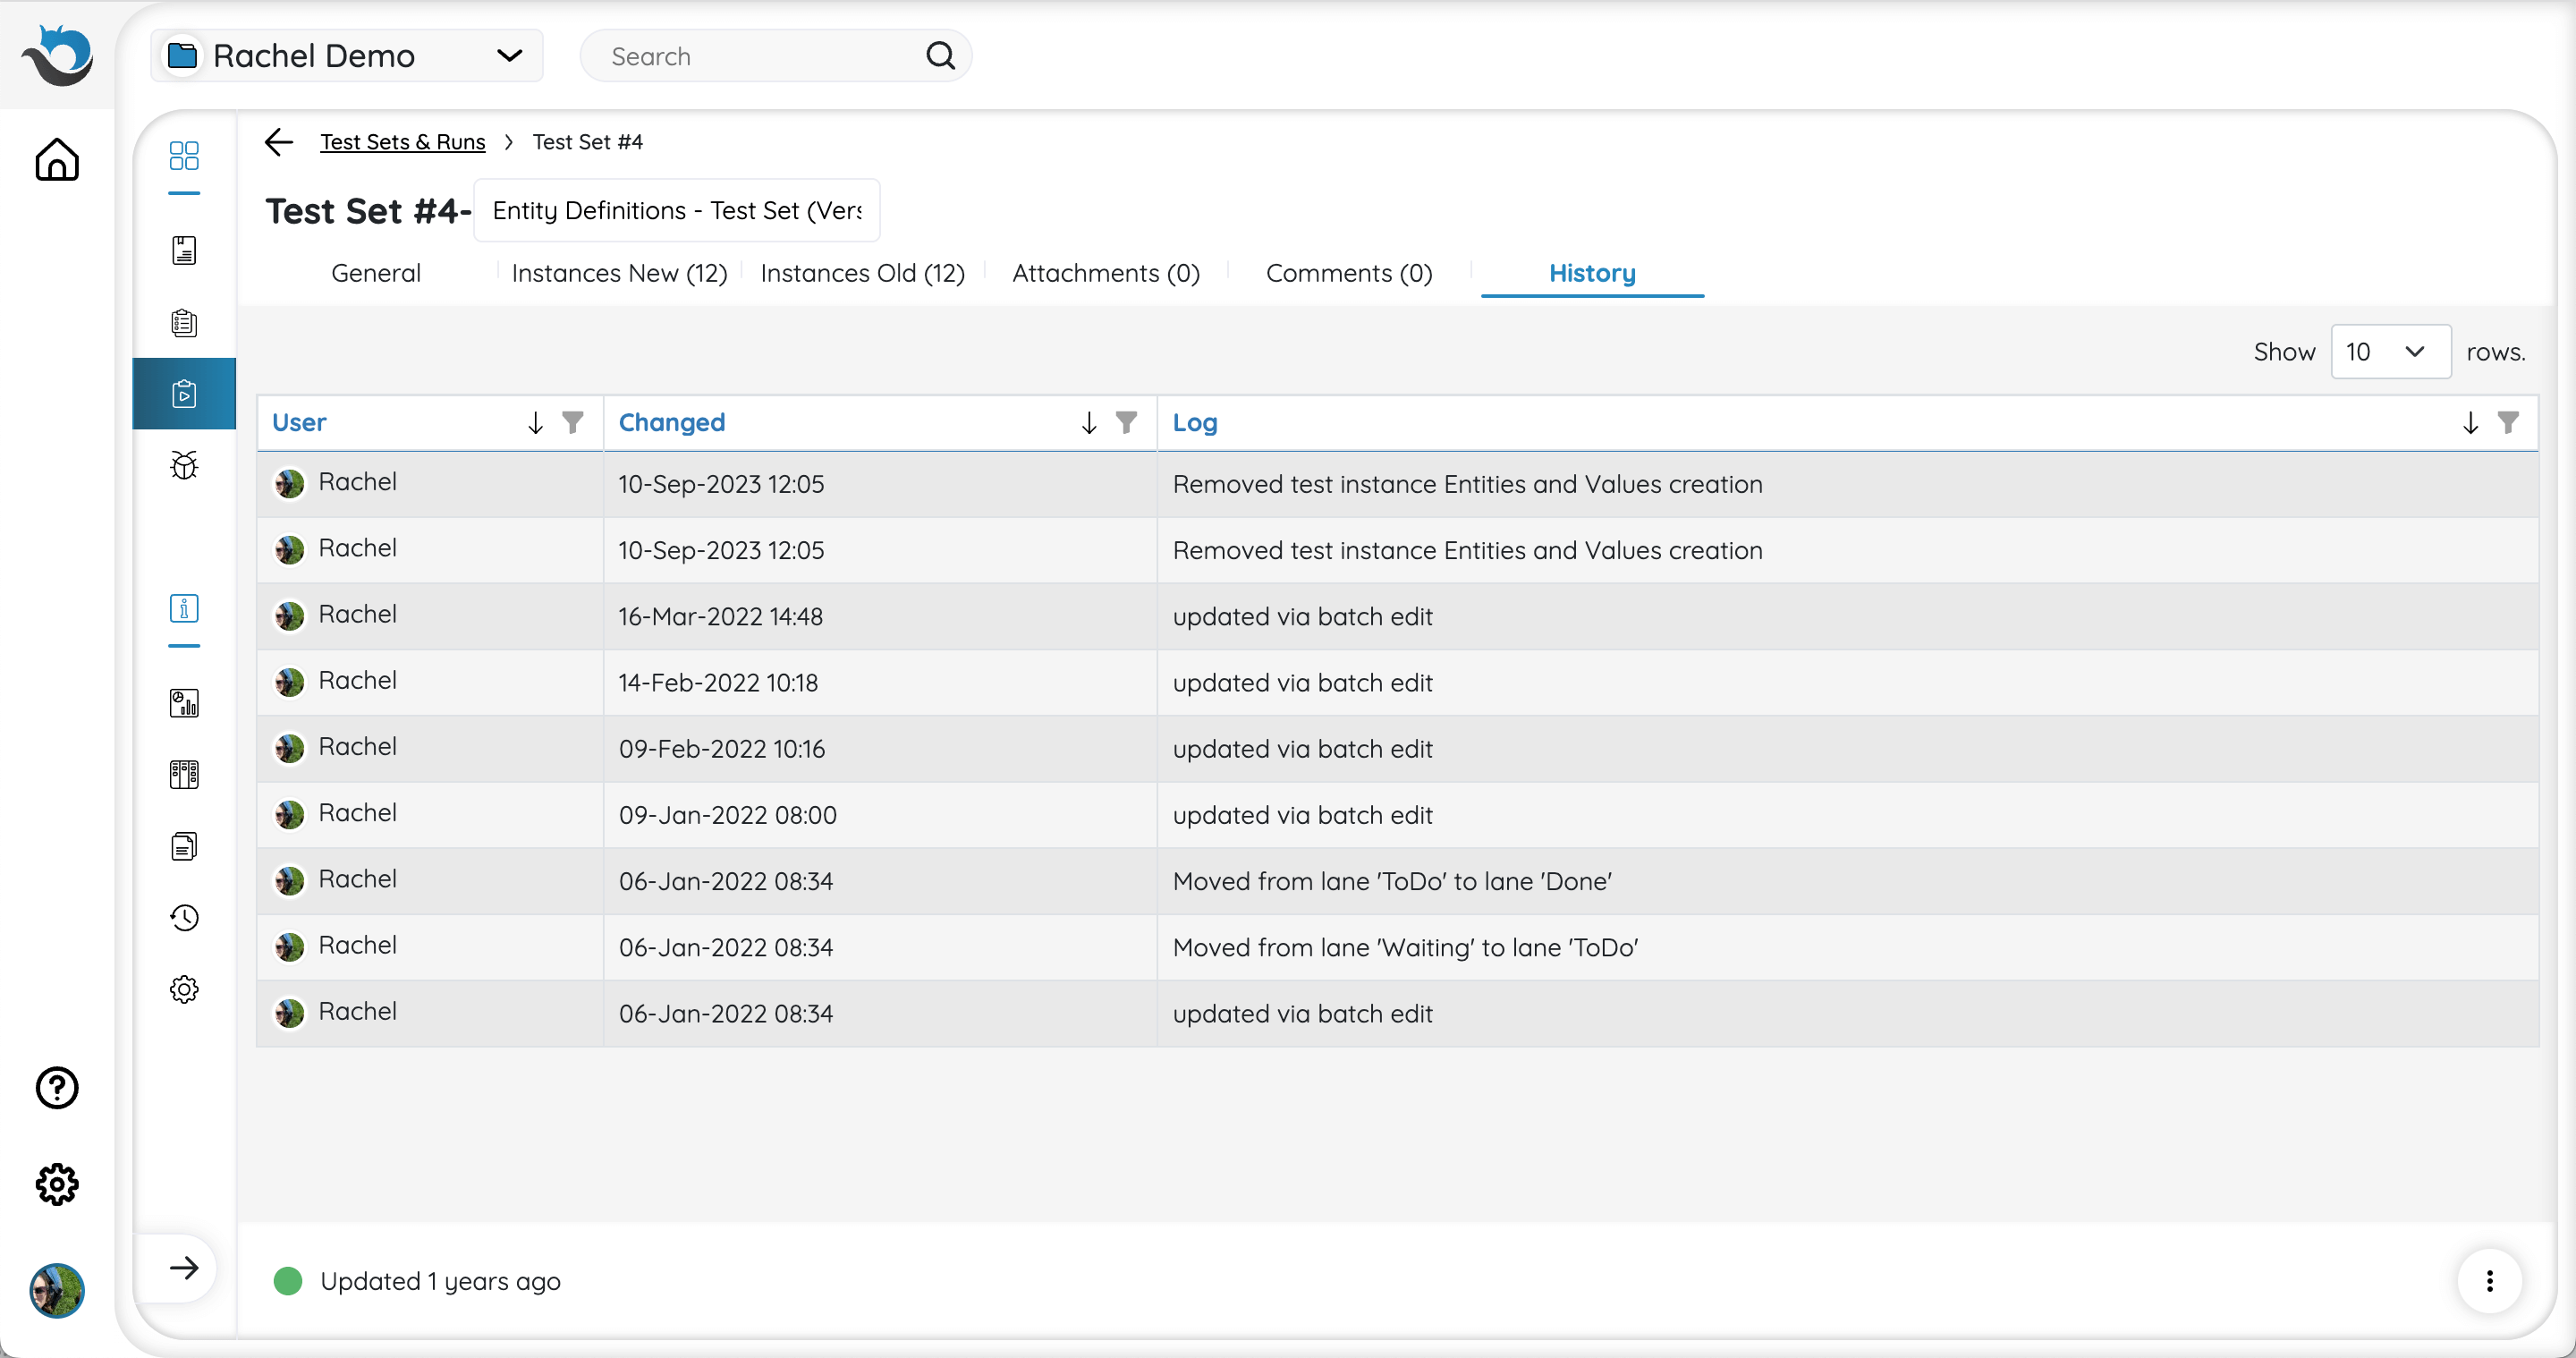
History
View the activity history log of your Test Set.
Time Management
Plan your testing assignments better with our Time Management feature. Gain greater control and visibility into your team’s work by:
- Improving testing cycle planning and assignment using accurate time management
- Tracking duration of test runs, comparing it to estimates, and making corrections online
- Gathering information on the average time a test takes to run
- Reporting time metrics and embedding them into any external dashboard
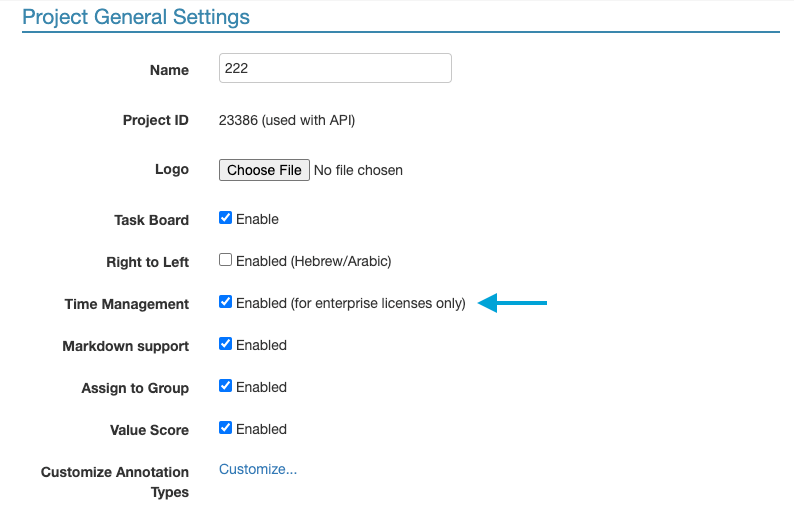
In order to enable Time Management on existing projects, go to Project Settings and check the ‘Time Management’ box.
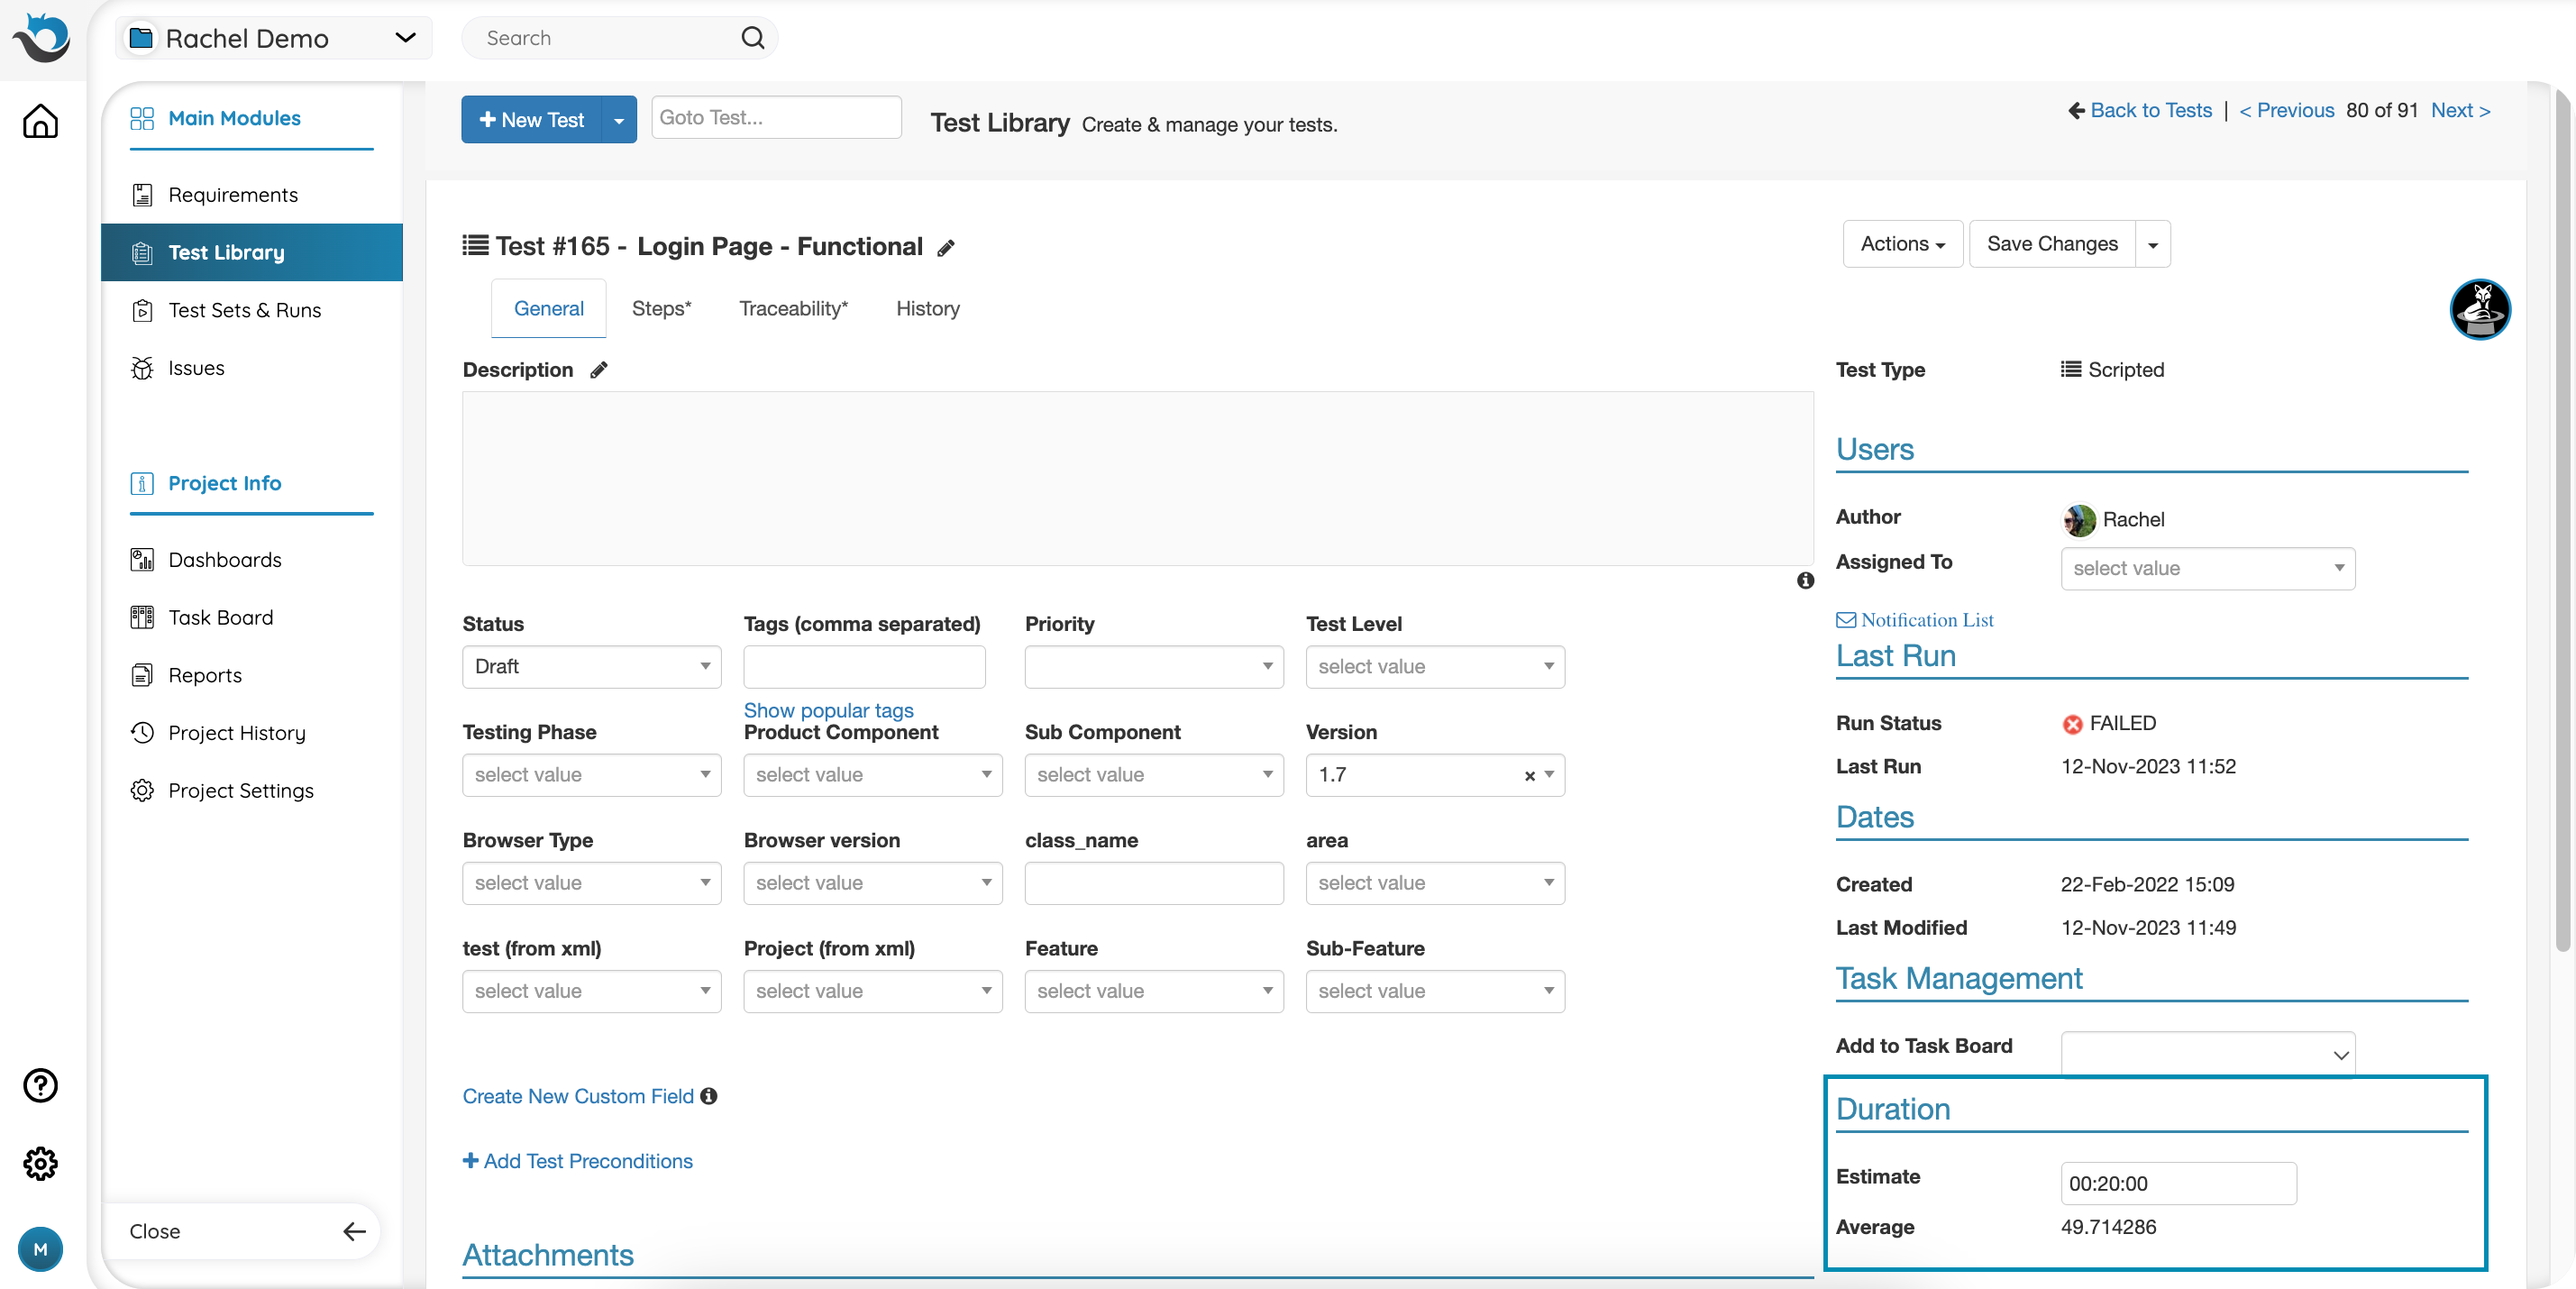
When creating a new test or editing an existing test in the test library, enter an estimated duration. For more information, read this guide.
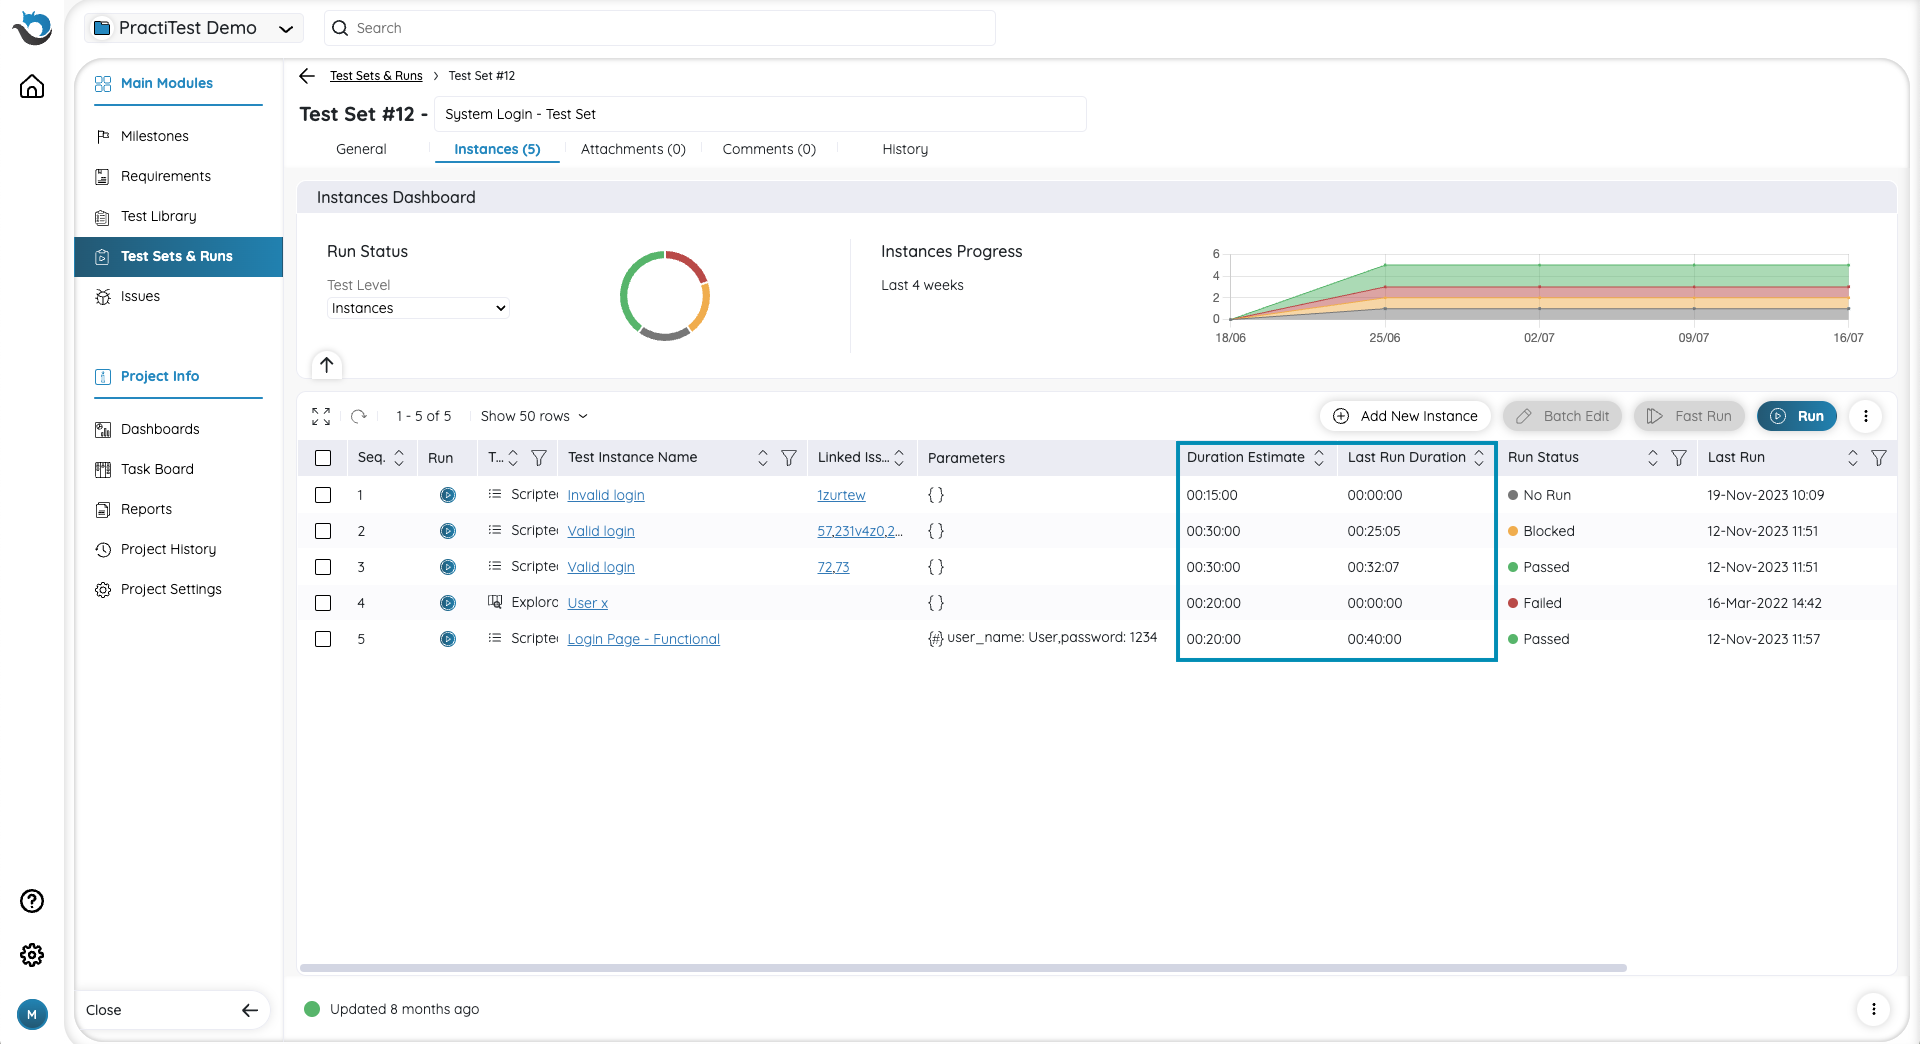
Based on the information you entered in the test library, each test in the Test Set displays its estimated duration as well as the total estimate for the entire Test Set. The total estimate is the sum of all existing test times defined in the Test Library.
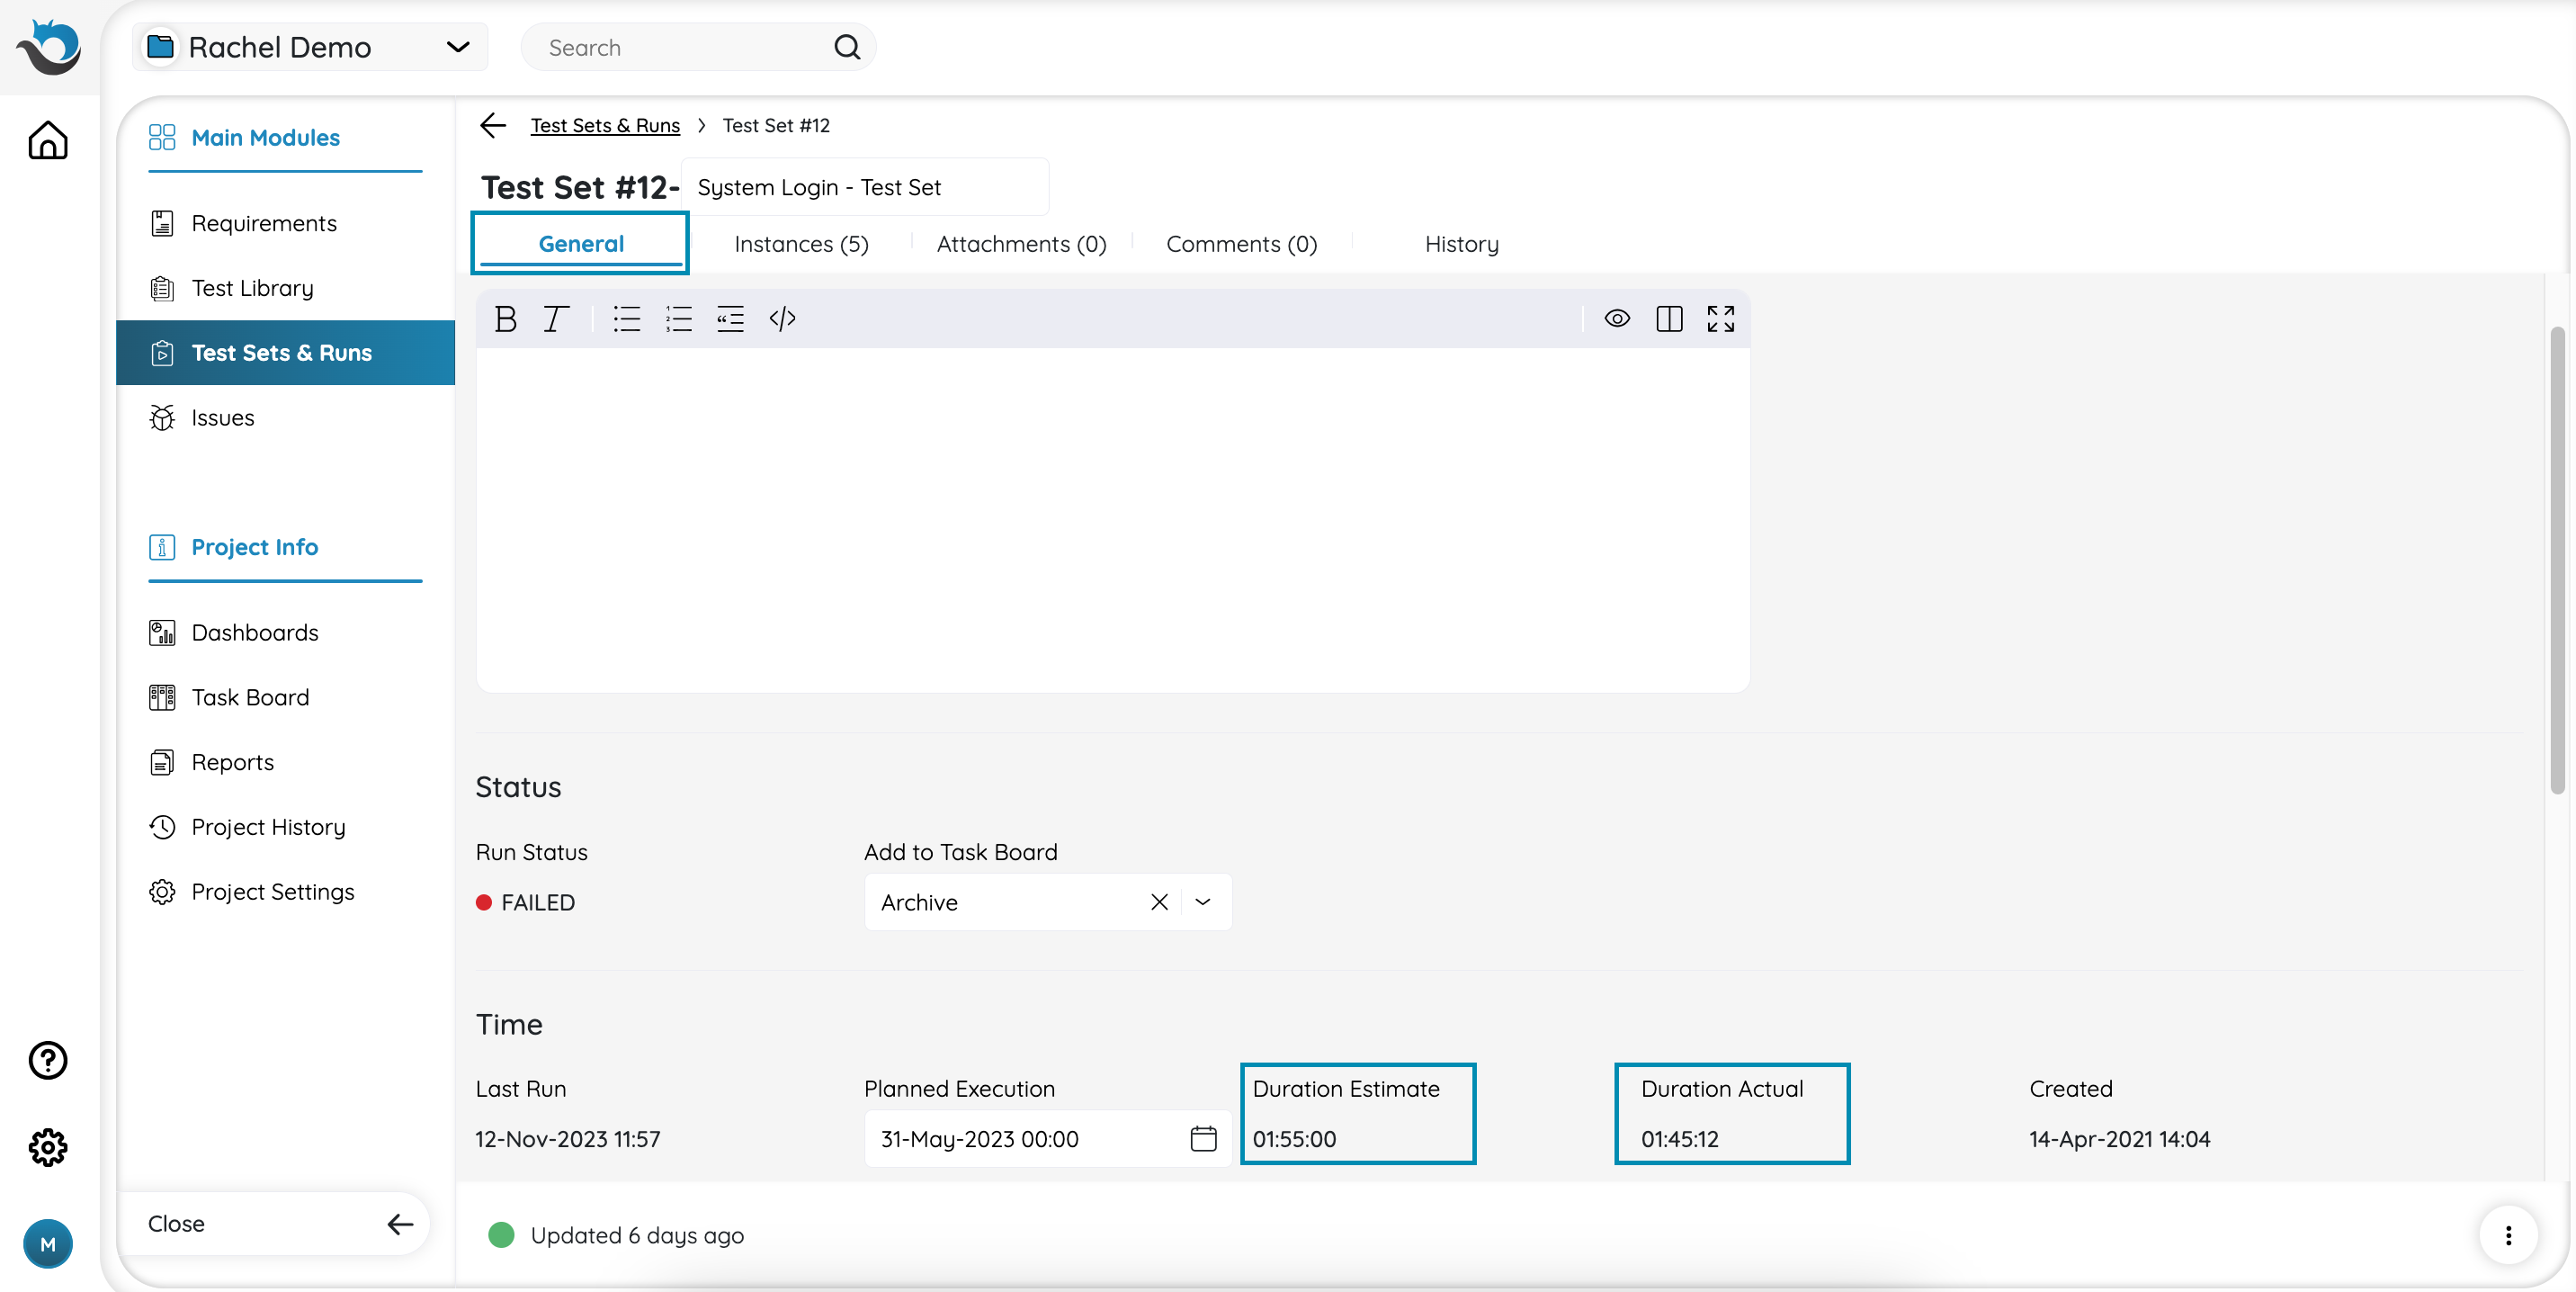
While you run each test and enter results, the timer will run simultaneously. You can pause, edit and resume as needed to reflect the actual run duration.
After the run is complete, the Test Set and Instances are updated, as well as the Test, and Instance Runs:
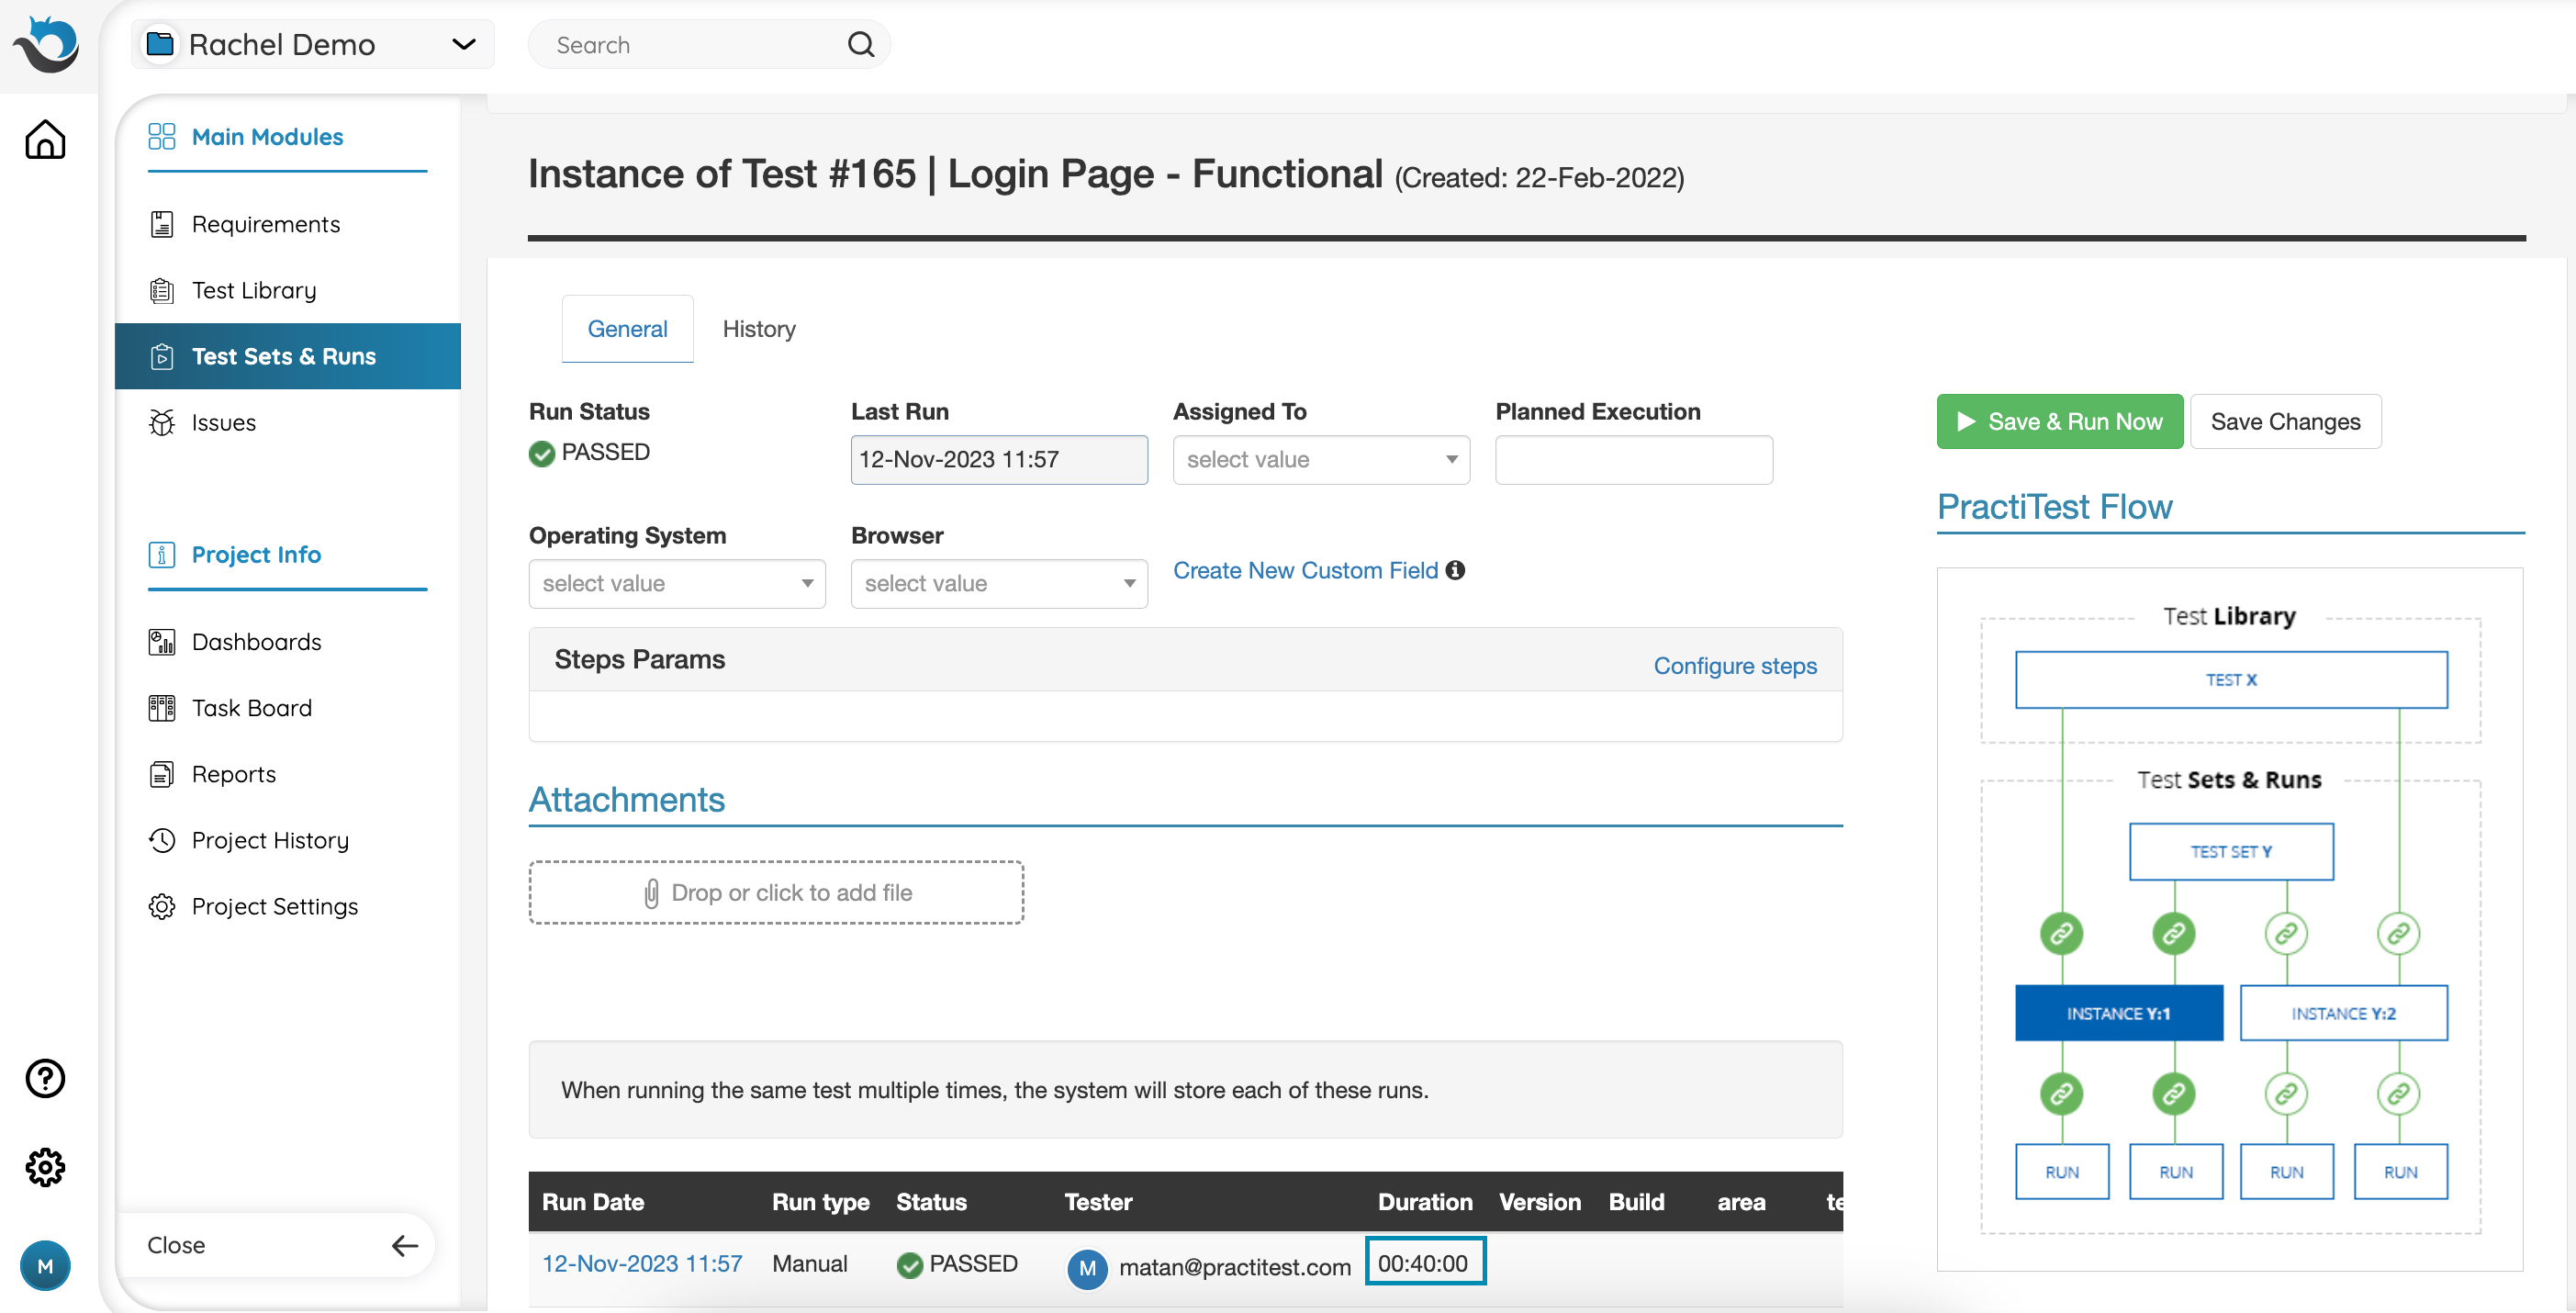
Note: Run duration should exceed 15 seconds to be recorded as an “Actual” duration. In case of 30 minutes of inactivity within the page, the timer will automatically pause.
In addition, the Running Time won’t be resumed in case you are entering the existing Test Run that was completed (there are no steps with NO RUN status). Click ‘Resume’ in order to manually resume the running time.
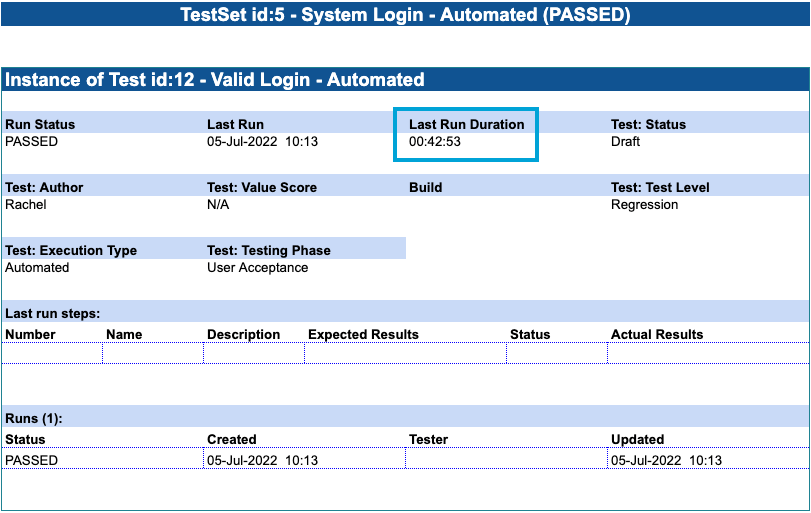
Want to see a summary of Time Management results? You can generate detailed reports in PractiTest. Read more about reporting here.
Test Sets & Runs Status and Data Representation
Test Run Status
Test run status is visible both in the run window and in the runs history grid in the instance window. It is also reflected in other entities as a field. For example, in the Test Instance grid in the Test Set window, you can see the last run status or in the original test, you can find the last run status.
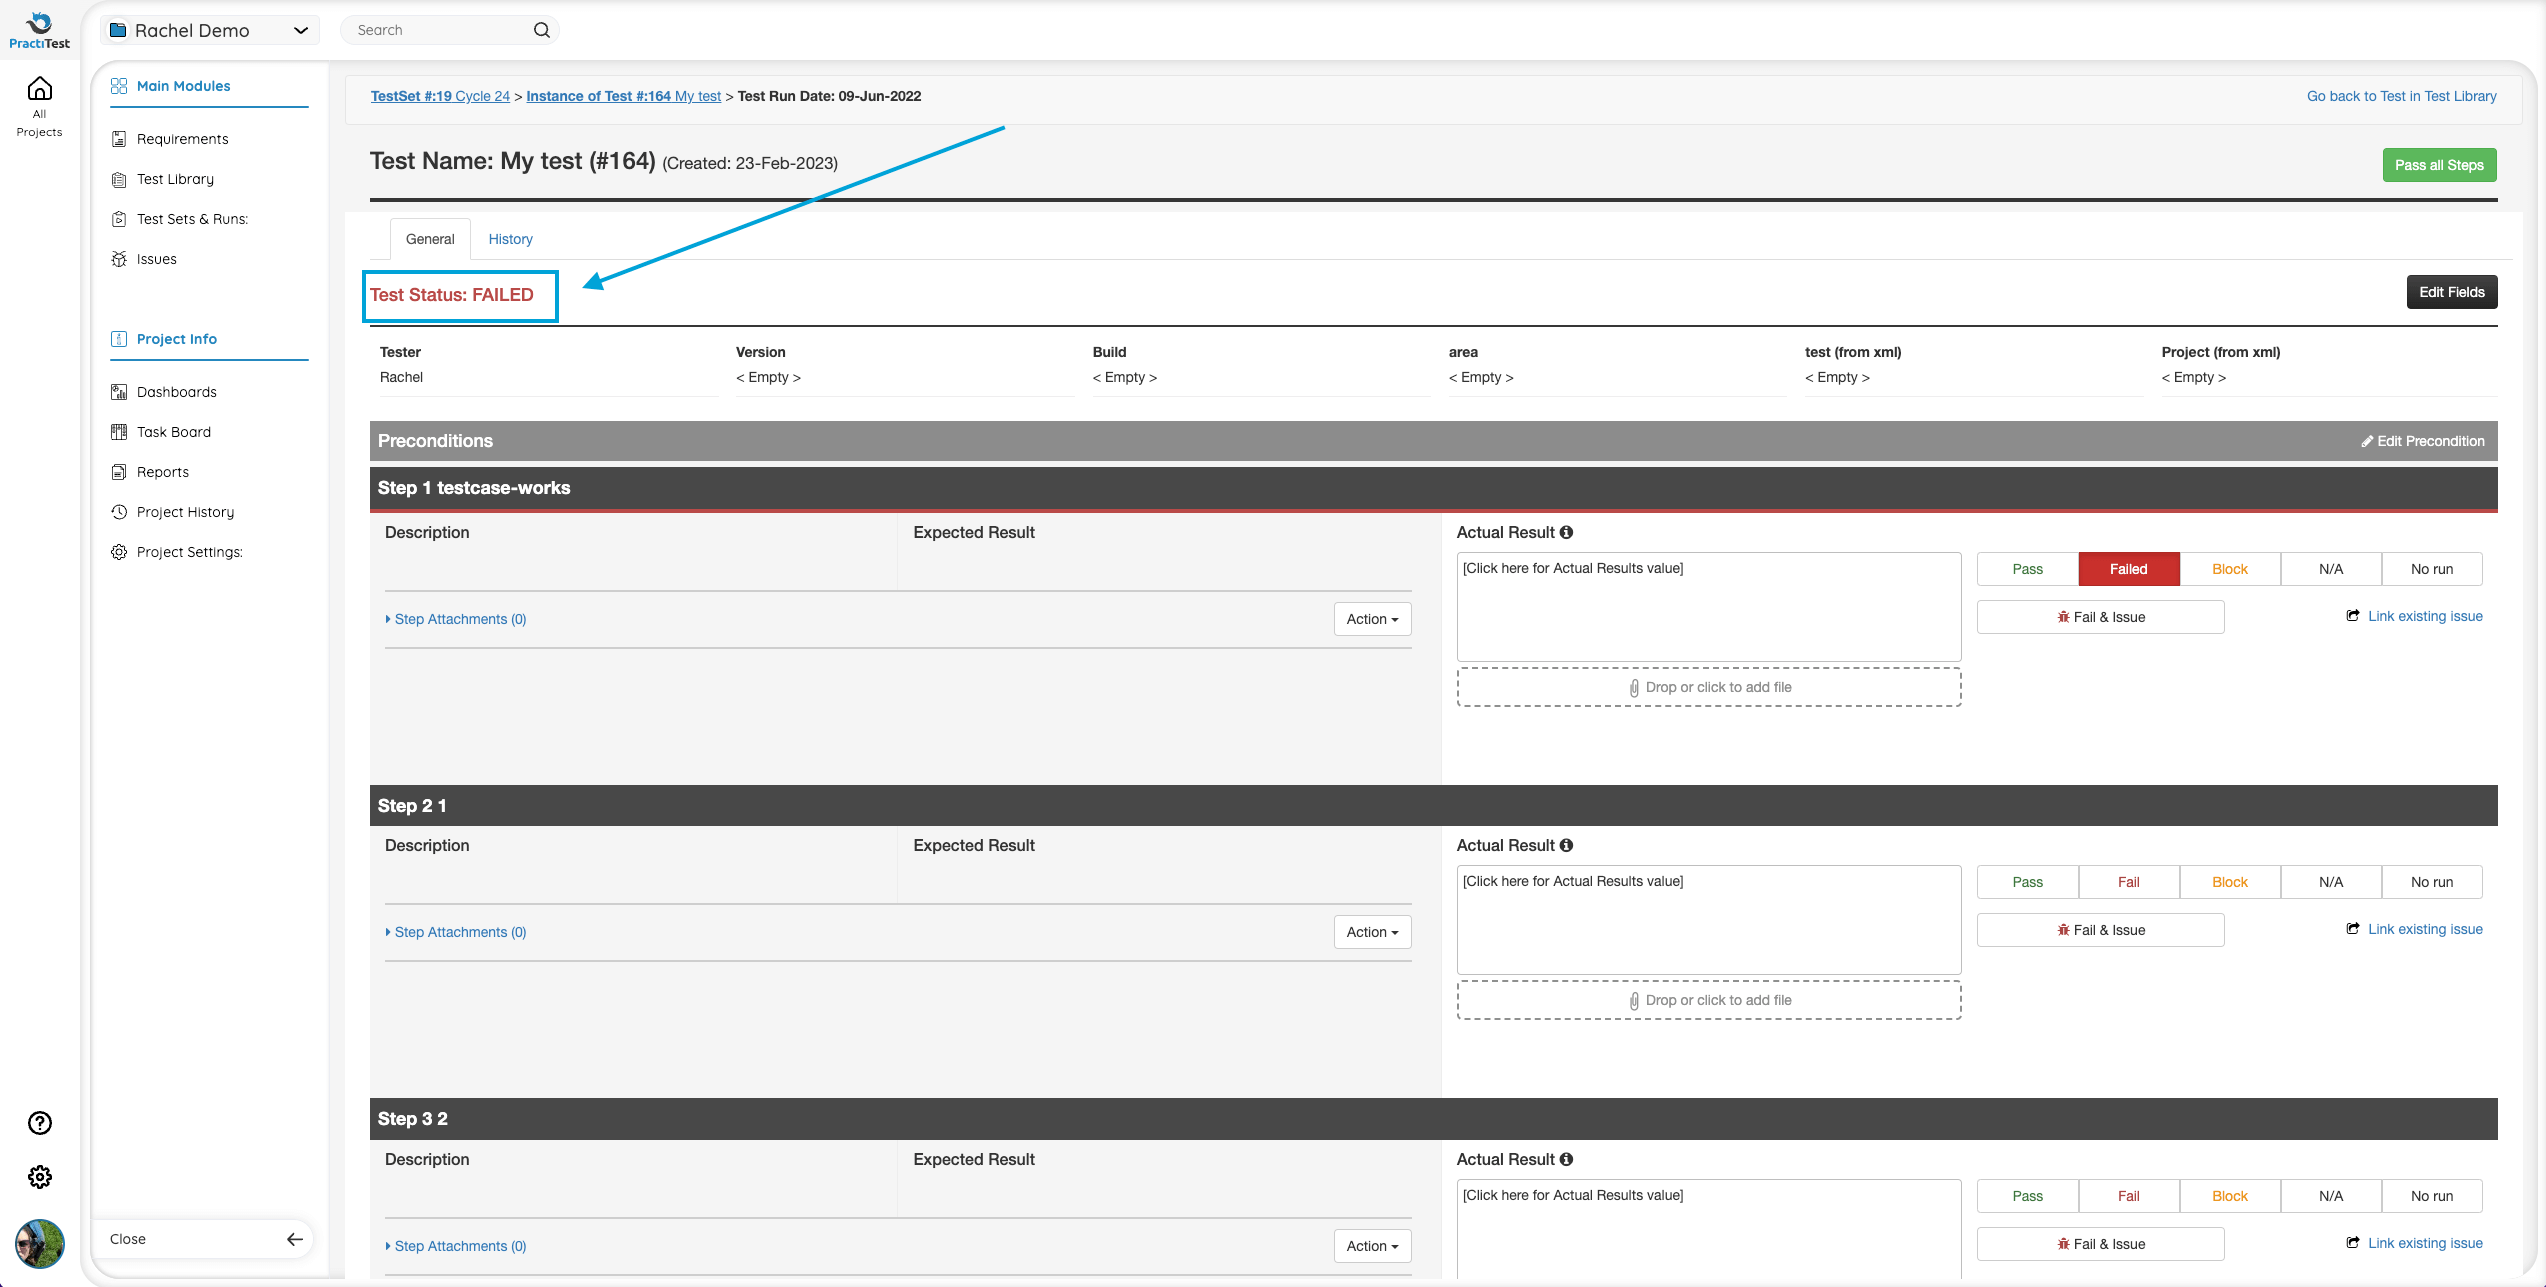
- By default, before any steps are run, the status of a Test Run is set to NO RUN
- If there’s at least one FAILED step, then Test Status is Failed
- If there’s at least one step which is BLOCKED (no FAILED steps), then status is BLOCKED
- Once the Test Run has begun, as long as all the steps you have run up to now are either Passed or N/A, and if you still have steps that you need to run, the status will appear as NOT COMPLETED
- Only if all steps of the test are defined as PASSED, then the test status will be PASSED, as well. Some may be defined as N/A, in which case, they will be disregarded
- If all steps are set to N/A, the status of the Test Run will appear as N/A, as well.
The Test Run Status that appears in the Test Library reflects the status of the last time that test was run on any test set.
Sometimes it can be easier to view the code to understand how it works:
xBot Test Run Statuses
Here are the optional statuses for an xBot test with a description:
- PASSED - The test ran and the result is 0
- FAILED - The test ran and the result is anything but 0
- RUNNING - The test run was taken by an agent. The agent is now running the user script on the user machine
- PENDING - The user clicked the run button (on the set/instance/run) and the run was added to the runs queue. The run is now waiting for an agent with a matching client type to be available to run/execute this run. If no agent picks up the test, it is because the agent is busy, the client type does not match, the agent is disabled, OR the run is scheduled for later
- CANCELED - The execution was canceled while it was running (please see below)
- ERROR - The xBot agent failed to execute the test and the run/script execution was not completed, such as when the script doesn’t exist, or is not executable
Test Set Run Status
The Run Status of a Test Set is calculated similarly to Tests Run Status.
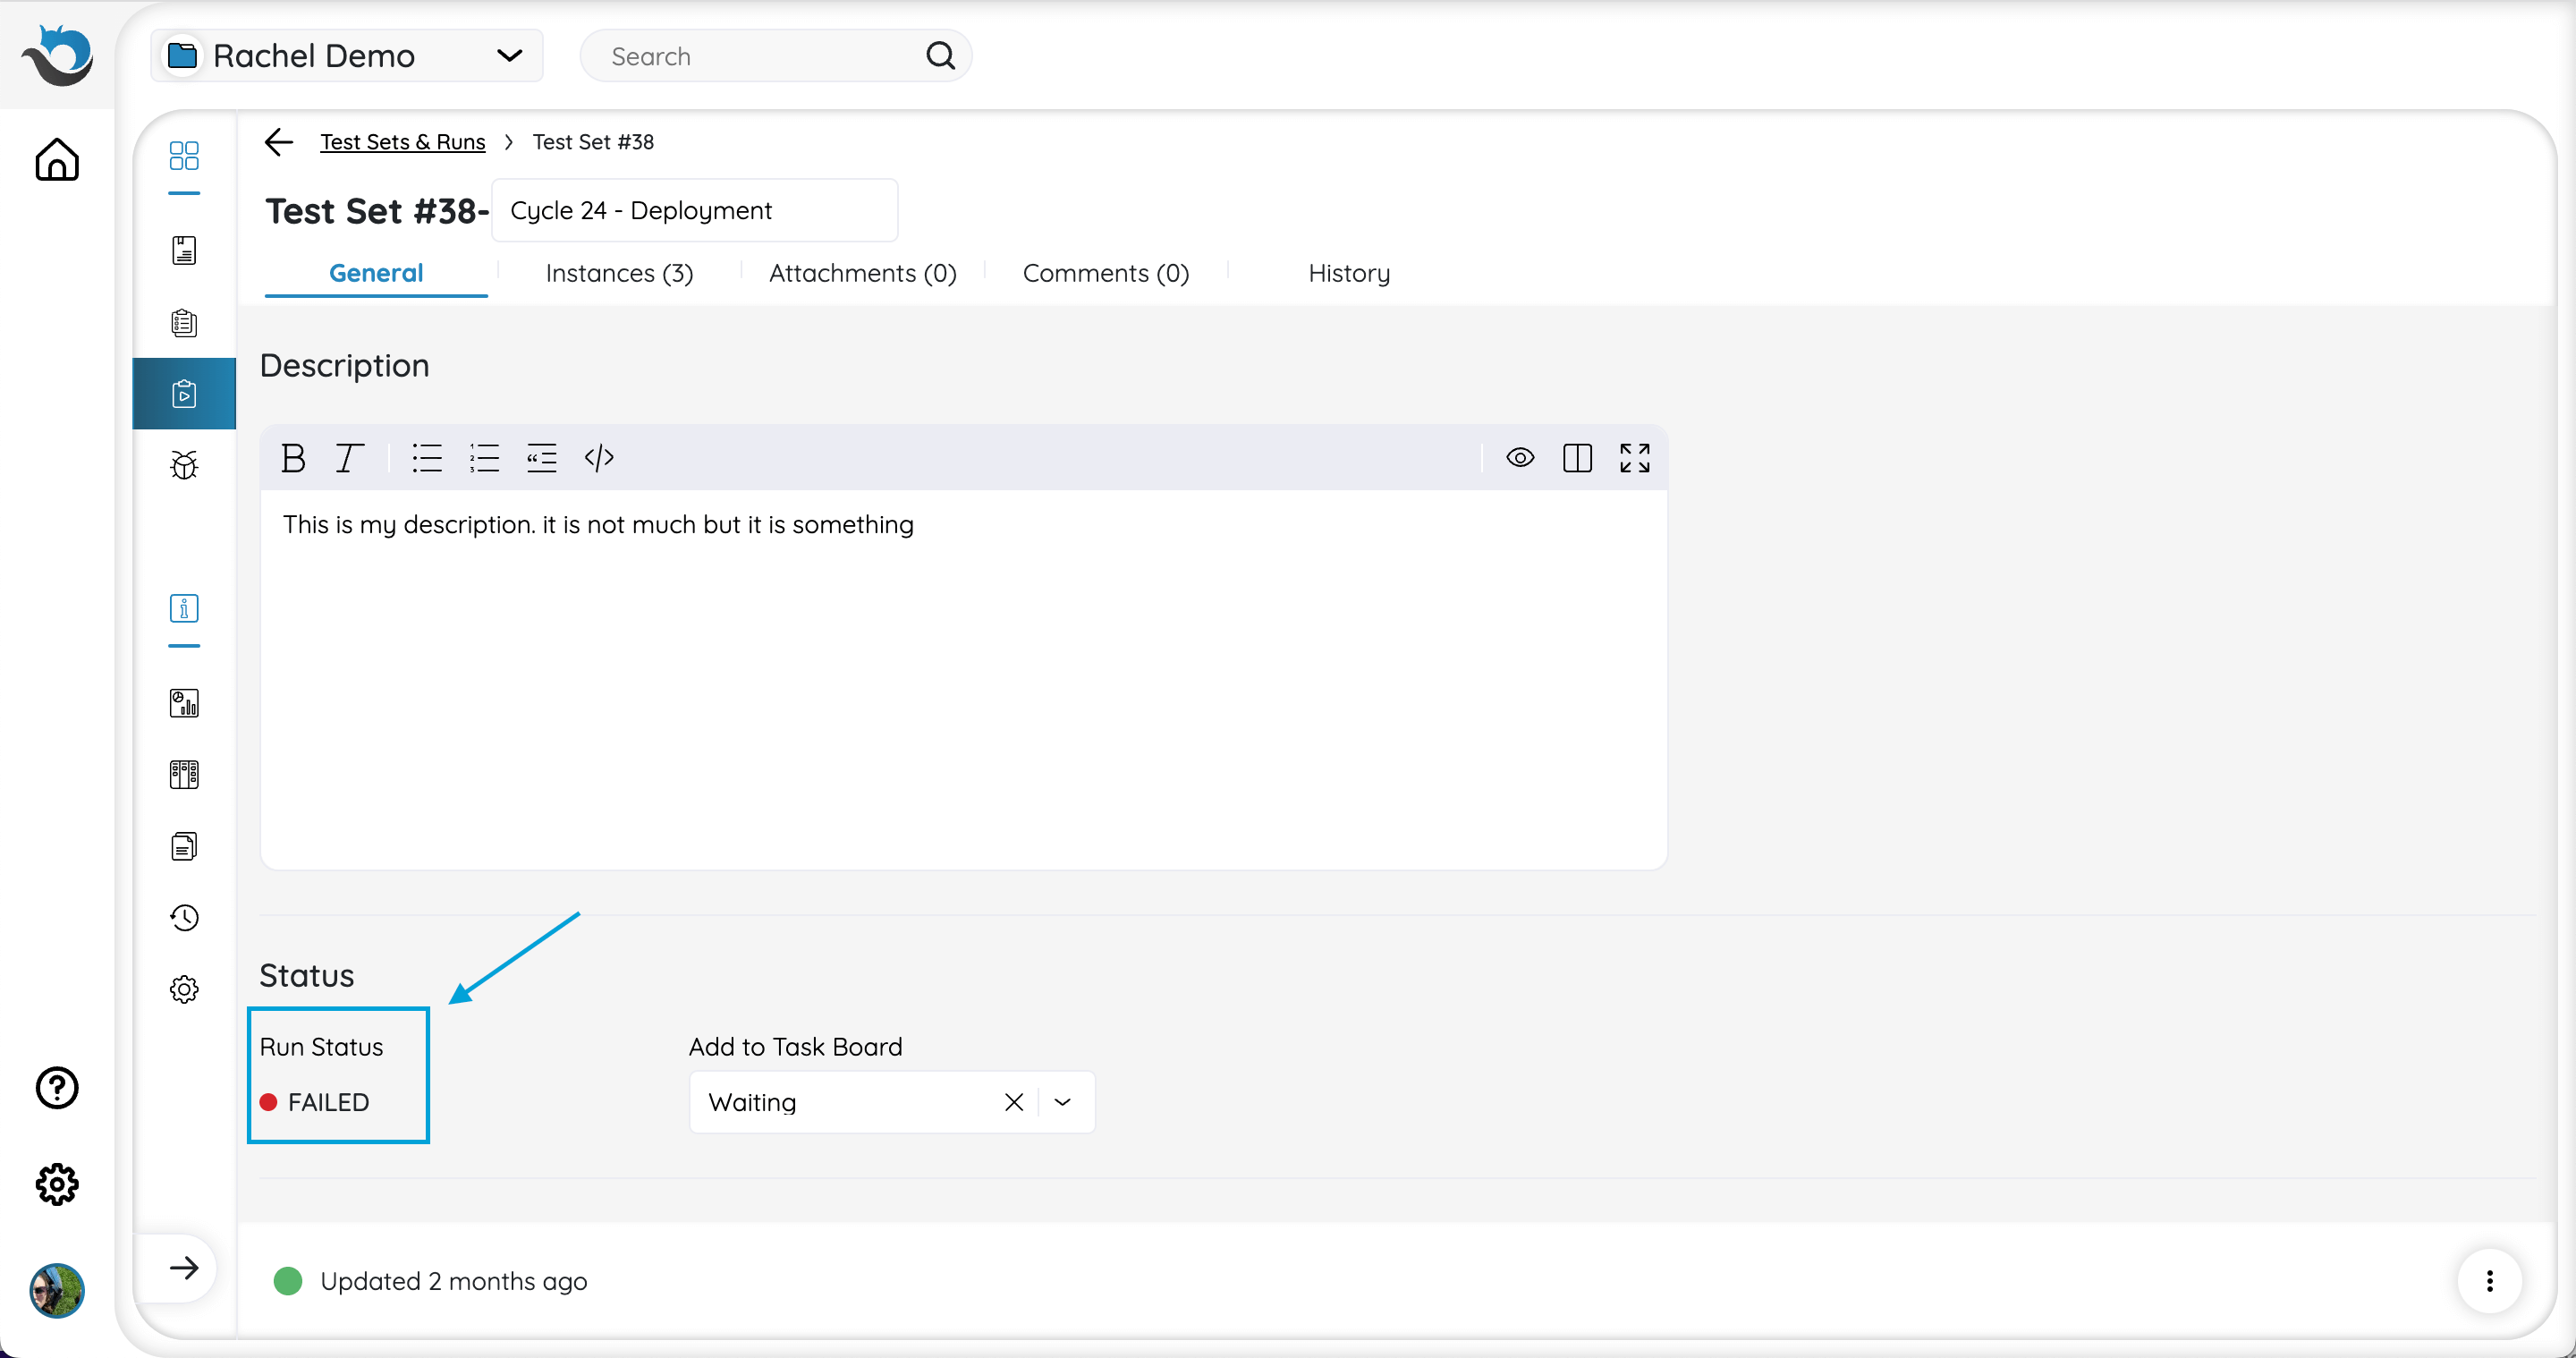
- By default, the status of a Test Set is NO RUN.
- Once the Test Set has begun running but has not yet finished, and as long as no Test Instances have been set to Blocked or Failed, the Test Set’s status will be NOT COMPLETE.
- If one of the Test Instances is BLOCKED and there are no instances with status Failed, the entire Test Set’s Run Status will be BLOCKED, as well.
- If one of the Test Instances of a Test Set is FAILED, it overrides any previous status (including BLOCKED) and the entire Test Set Status will be set to FAILED.
- Only if all Test Instances of the Test Set are PASSED, then the Test Set status will be PASSED, as well. Some may be defined as N/A, in which case, they will be disregarded.
- If all Test Instances of the Test Set are marked as N/A, the Test Set status will appear as N/A, as well.
Managing Test Sets
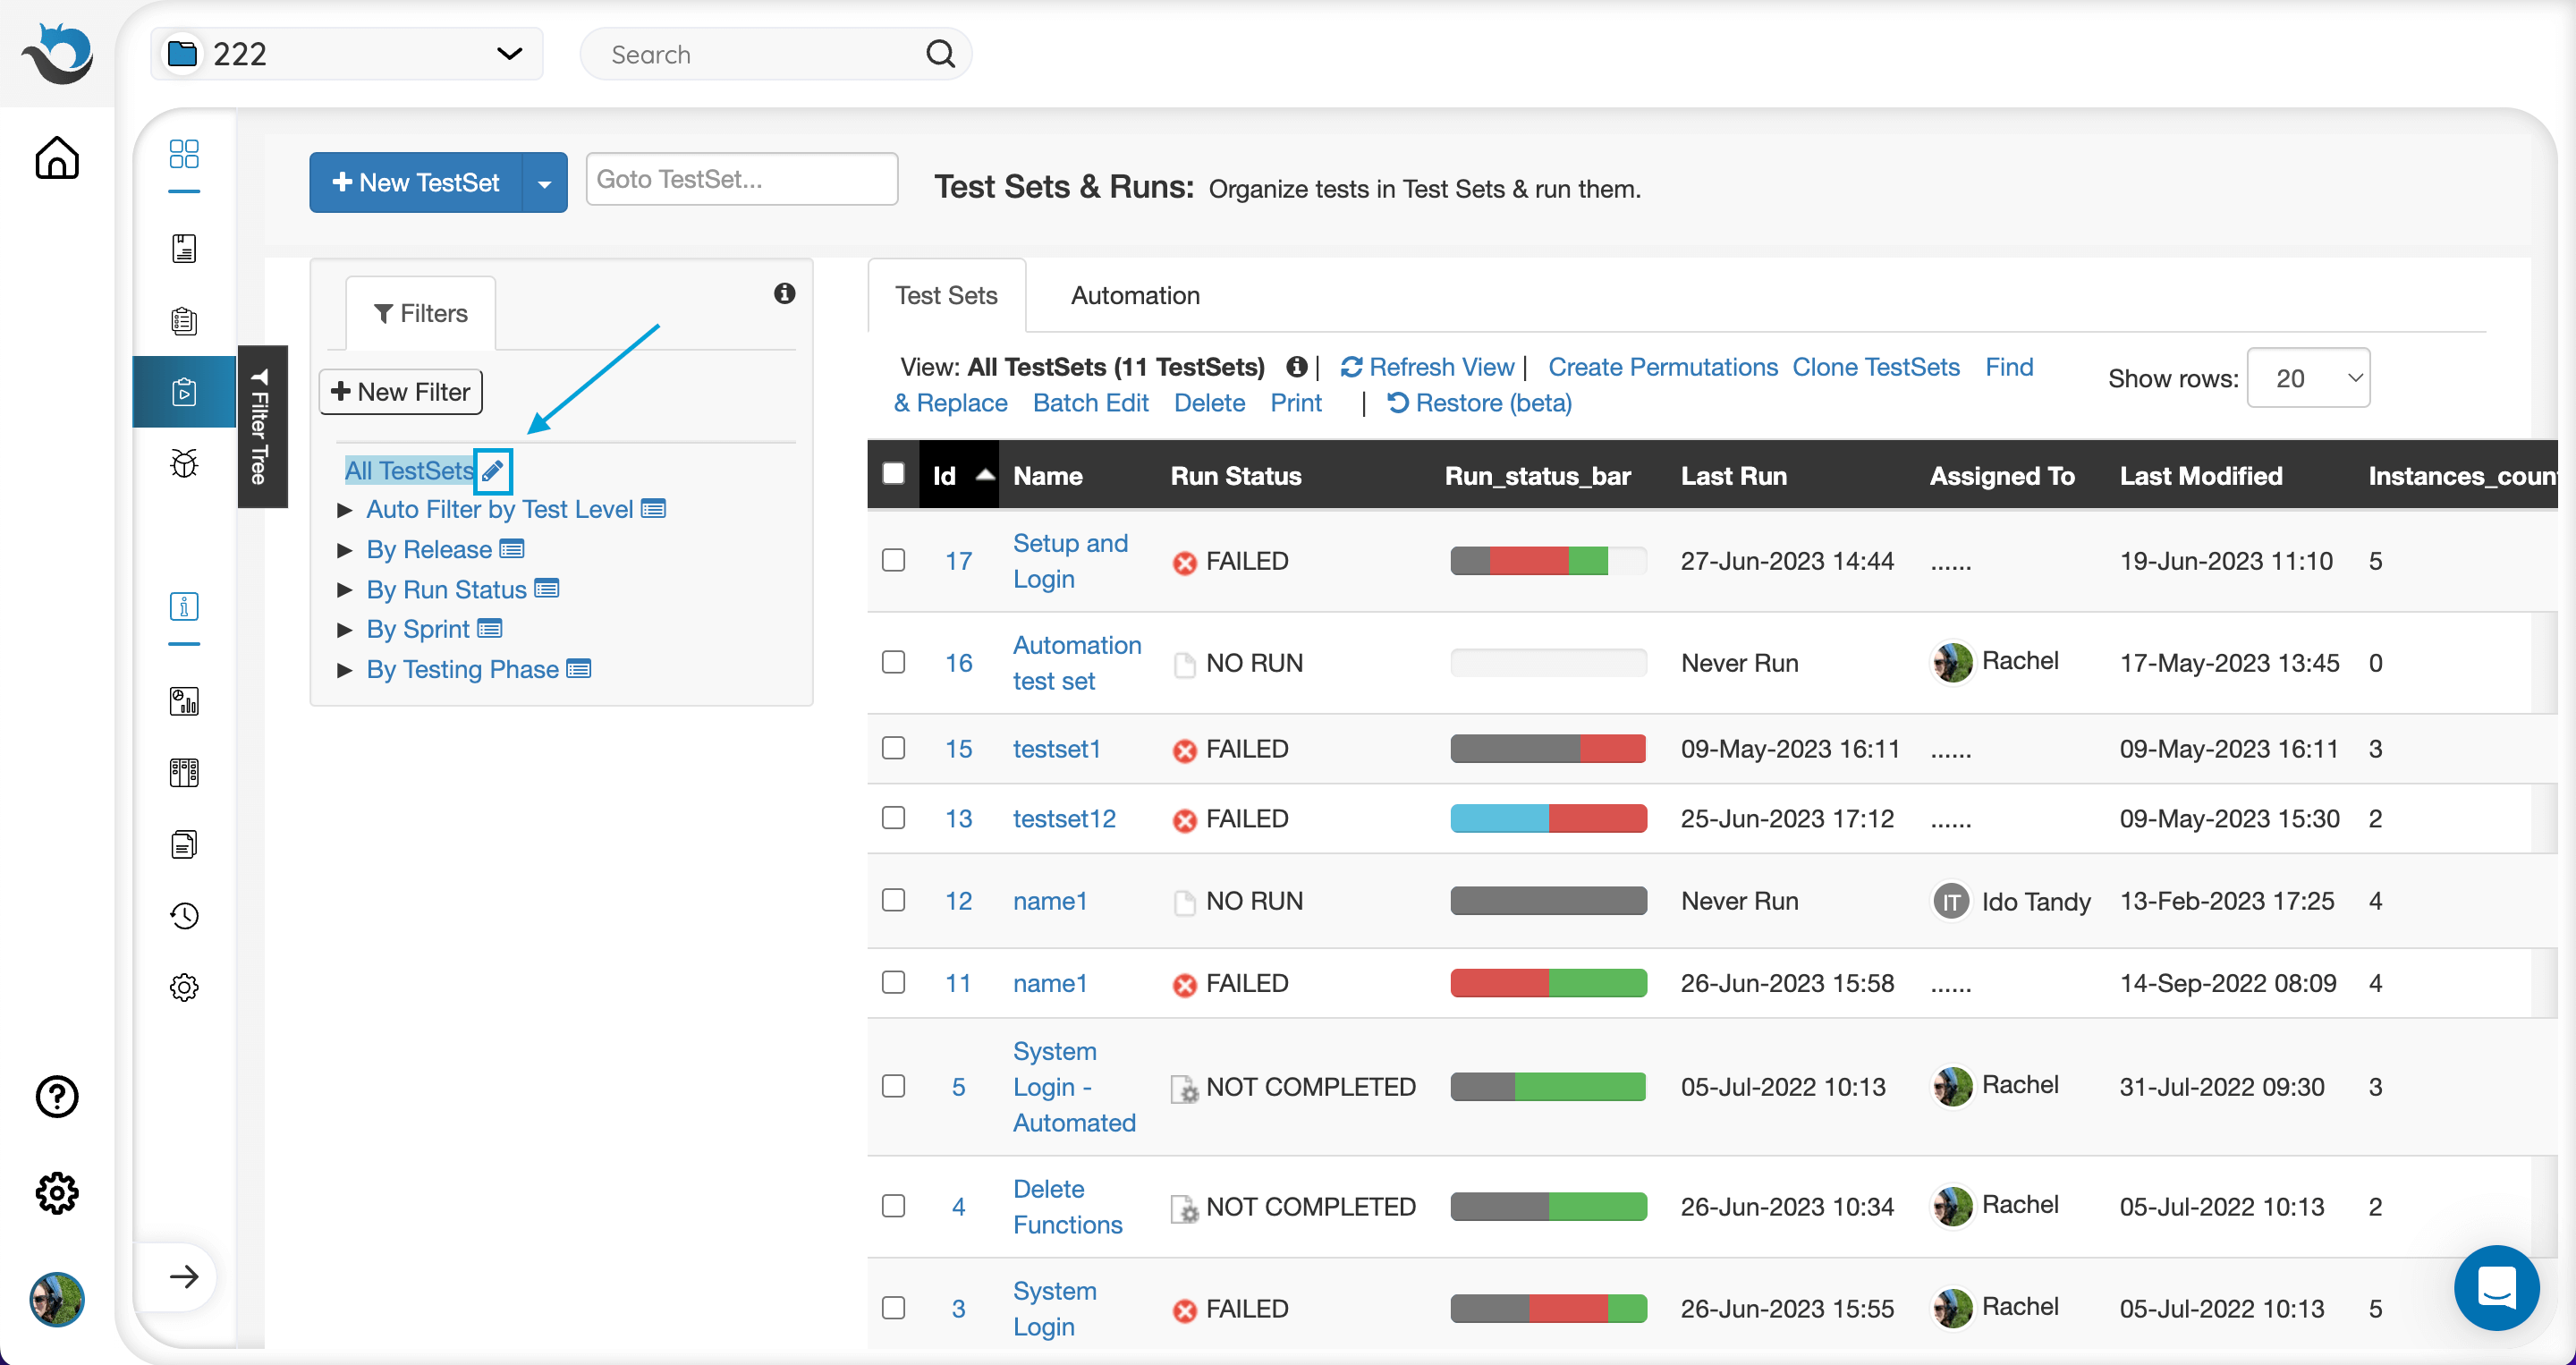
Test Sets are organized in PractiTest using Filters, in the same way that other entities are organized. To Adjust the columns of your main Test Sets view, click the three-dot button next to “All Test Sets” in the Filters window, and choose ‘Edit’.
If you want to view Test Sets related to a specific filter, you can search for the desired filter, which allows you to quickly find the needed Test Sets.

If you wish to rename a filter, click on the three-dot button next to the filter name and choose ‘Rename.’ Then, simply enter the new name and press ‘Enter.’

Test Set Permutations
Test Set permutations are a great feature when you want to test the same test sets and instances multiple times, such as supporting a large number of platforms, languages or configurations. In these cases, you can take one or a small number of test sets and create multiple test sets for each of the different combinations.
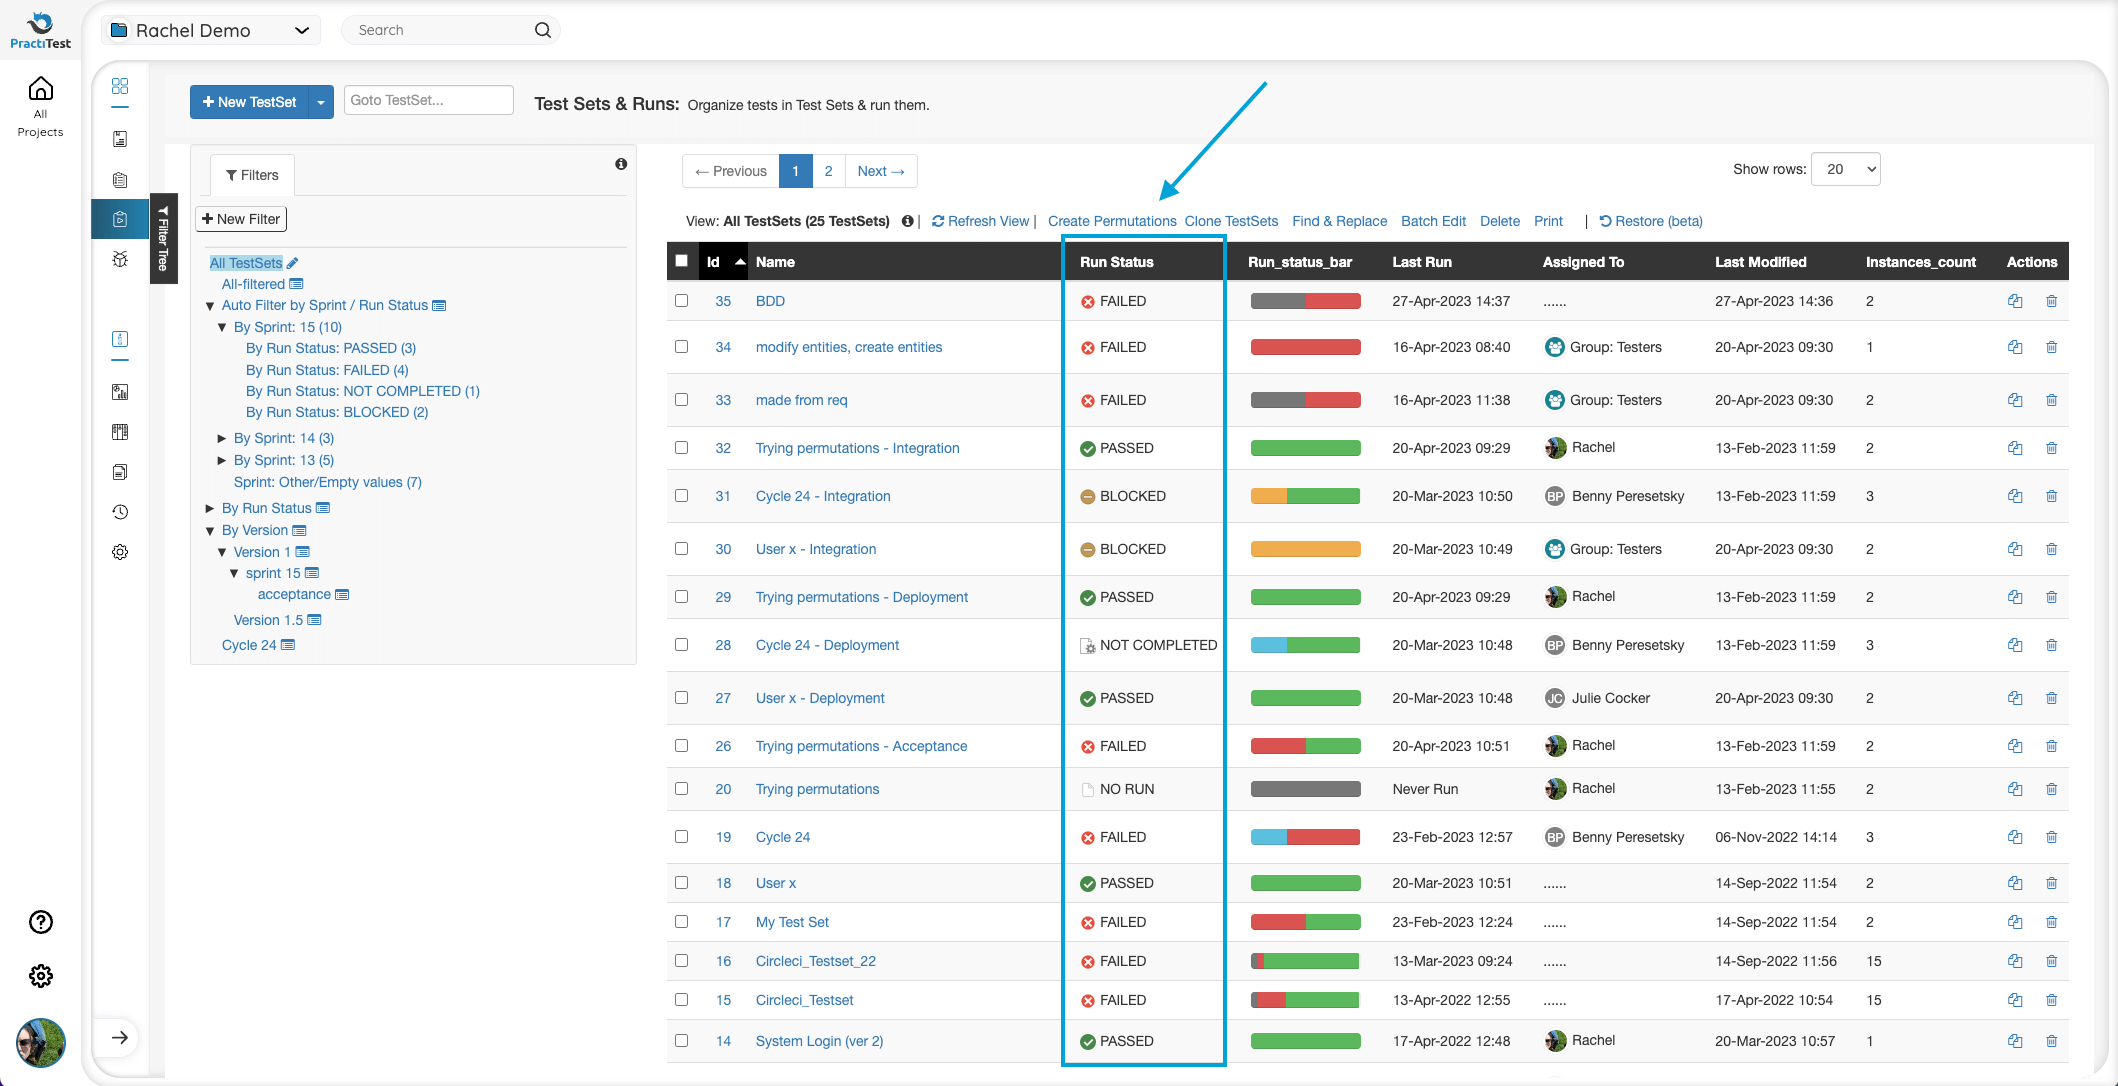
Create New Test Set Permutations
Note: Permutations can only be created on existing Test Sets. If you have a new empty project, create at least one Test Set first.
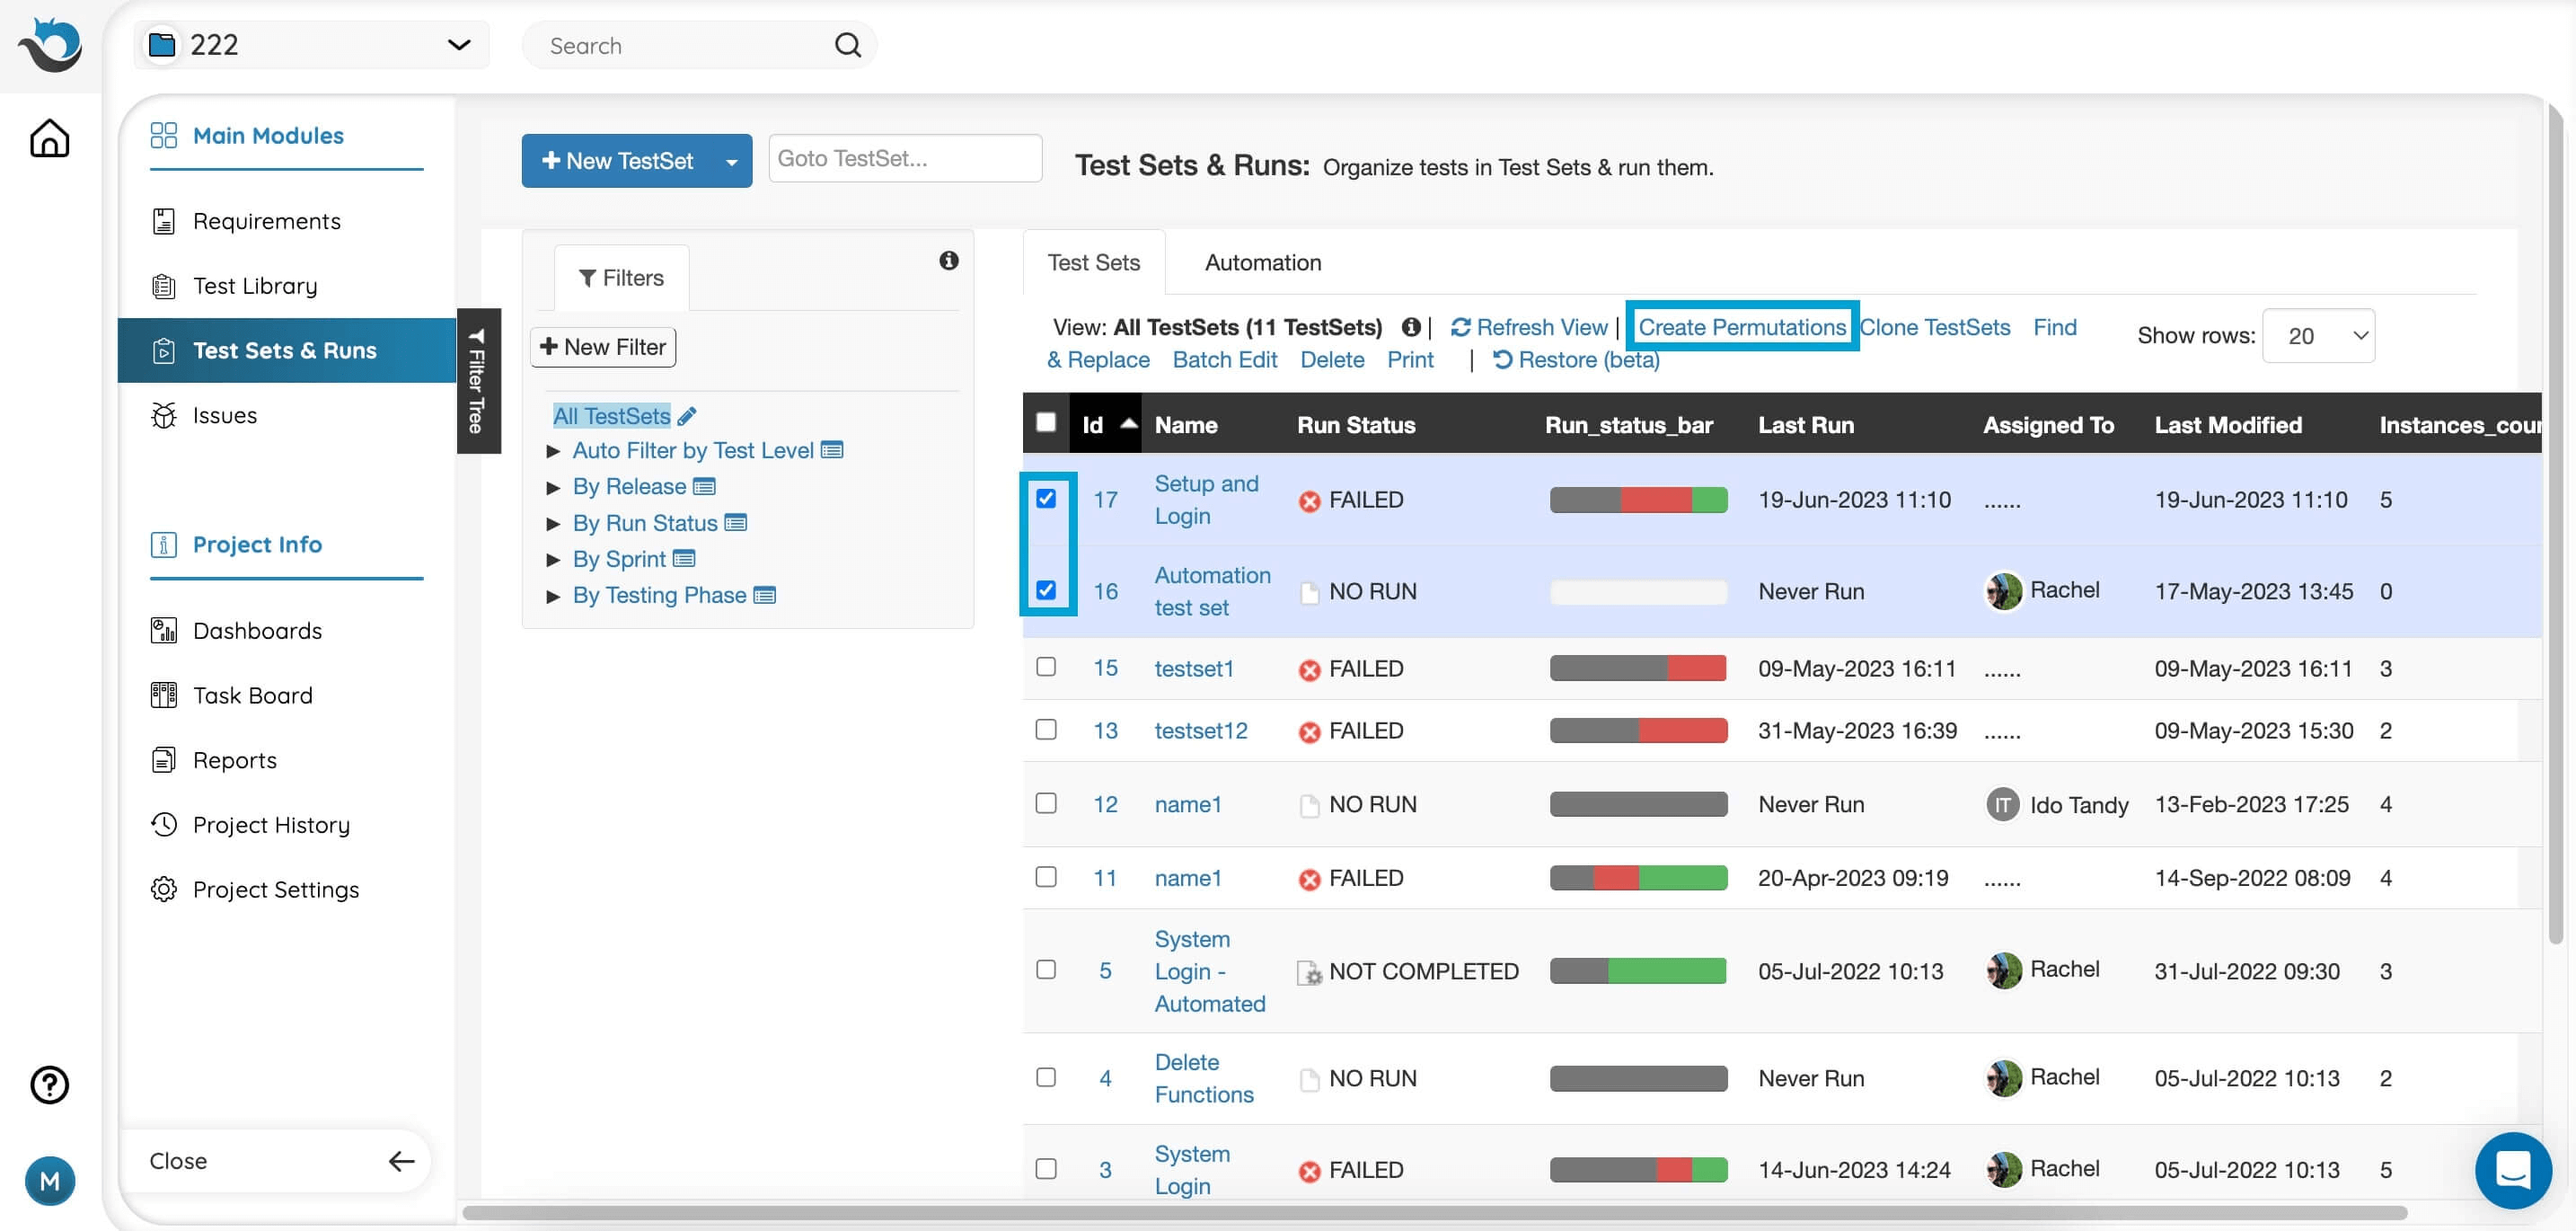
- Start in the Test Sets and Runs module and select the Test Set you would like to duplicate. Next, select ‘Create Permutations’ in the grid menu above. You can choose both multiple Test Sets or a singular Test Set.
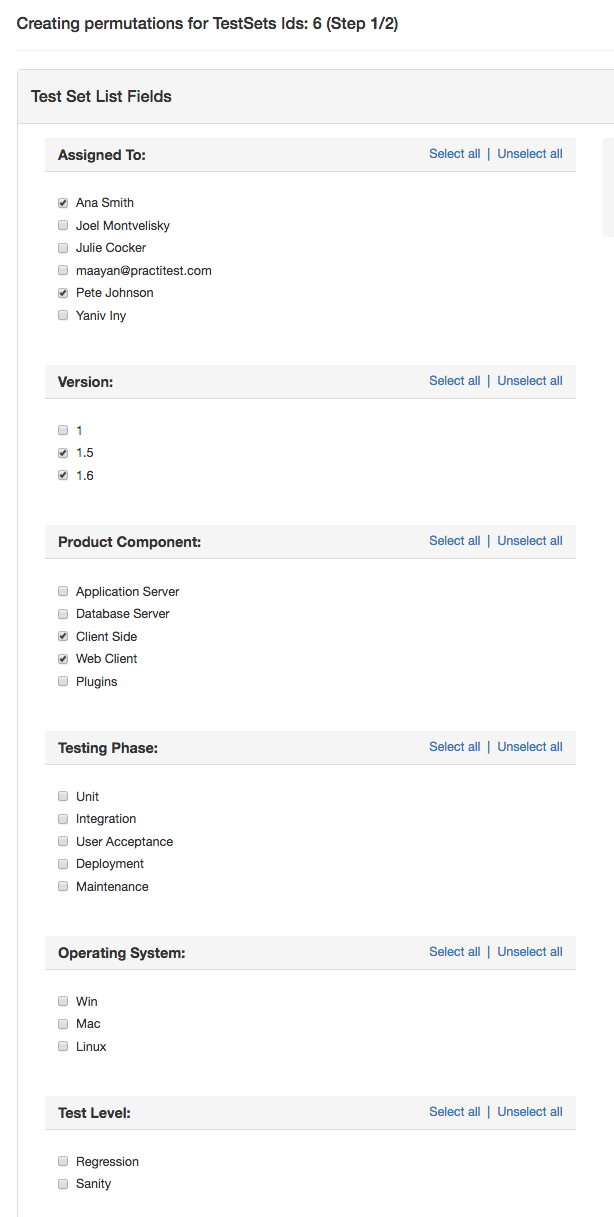
- The next screen will display all existing Test Set List Fields of both the system as well as your custom fields. To create permutations based on field value, select the checkbox next to the field name. Unchecked values will be ignored.
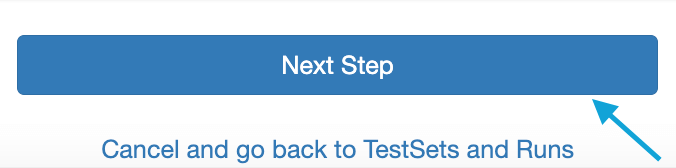
- After selecting all the values, click ‘Next step’.
- On the following screen you will see all the possible permutation combinations from the fields you selected. Confirm all or a number of the relevant permutations.
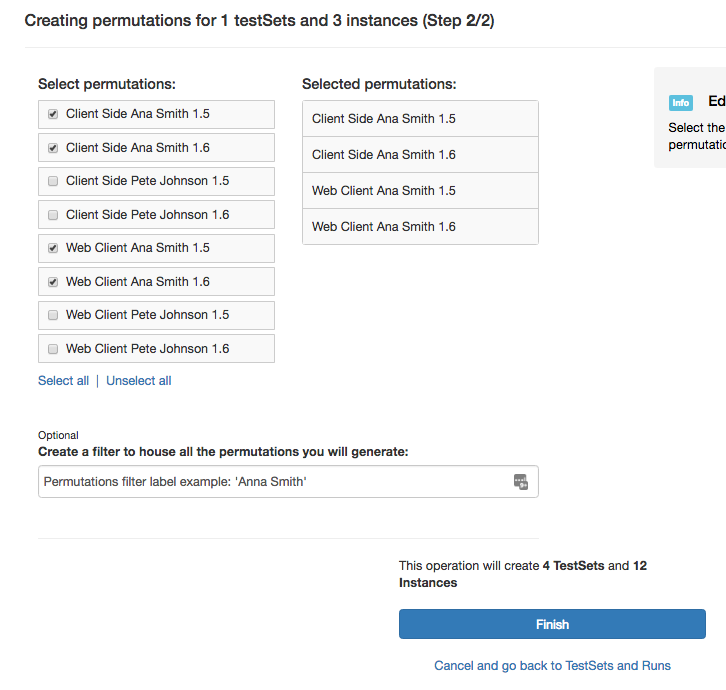
-
You can also define an existing filter under which these permutations should appear. Otherwise by default, all permutations will be created and placed under “AllTest Sets” in the filter tree. The resulting Test Sets will have the same name as the original one, with the addition of the permutations at the end, (for example, “Feature 123 – Windows;IE”).
Note: There is a max limit of 500 permutation combinations.
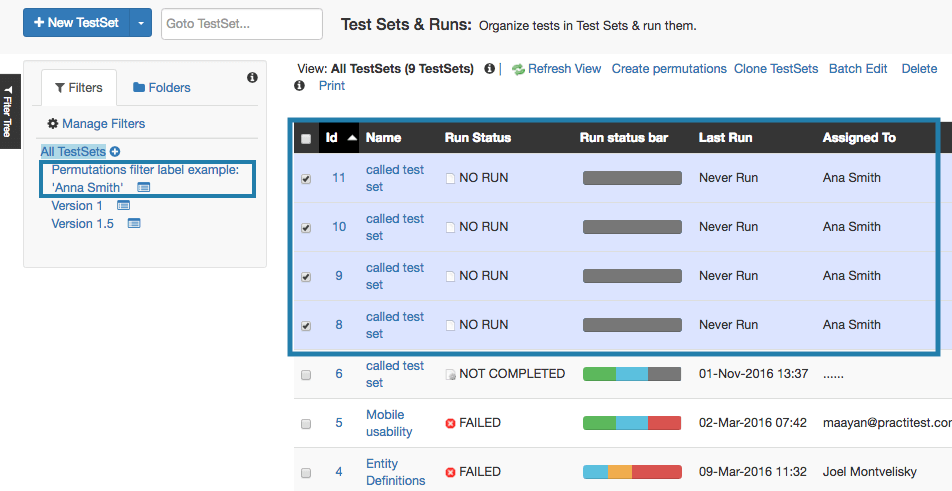
- Click ‘Finish’ and you’ll be returned to the Test Sets and Runs module, where your new Test Set permutation/s and their designated filter will appear. You will also receive a confirmation email regarding your project changes.
Find and Replace
To replace the same phrase in multiple Test Sets in a single action, select the desired Test Sets you want to perform the action on. Then, click the three-dot button at the top of the grid, and choose ‘Find & Replace’.

Enter a phrase you want to replace in the ‘Find’ field, and the value you want to replace it with in the ‘Replace with’ field.
Note: The ‘Find & Replace’ action is case-sensitive.
Choose to which areas and fields you want to apply the search. You can choose to replace it in all fields or to select only title fields, description fields, and so on.

After clicking ‘Find & Replace’, you will see a message at the top of the screen confirming how many test sets you are about to change. For example, if you choose 10 test sets, but the word you want to replace appears only in 4, you will see 4 test sets to be changed. After confirming the action, the phrase you entered will be automatically replaced.
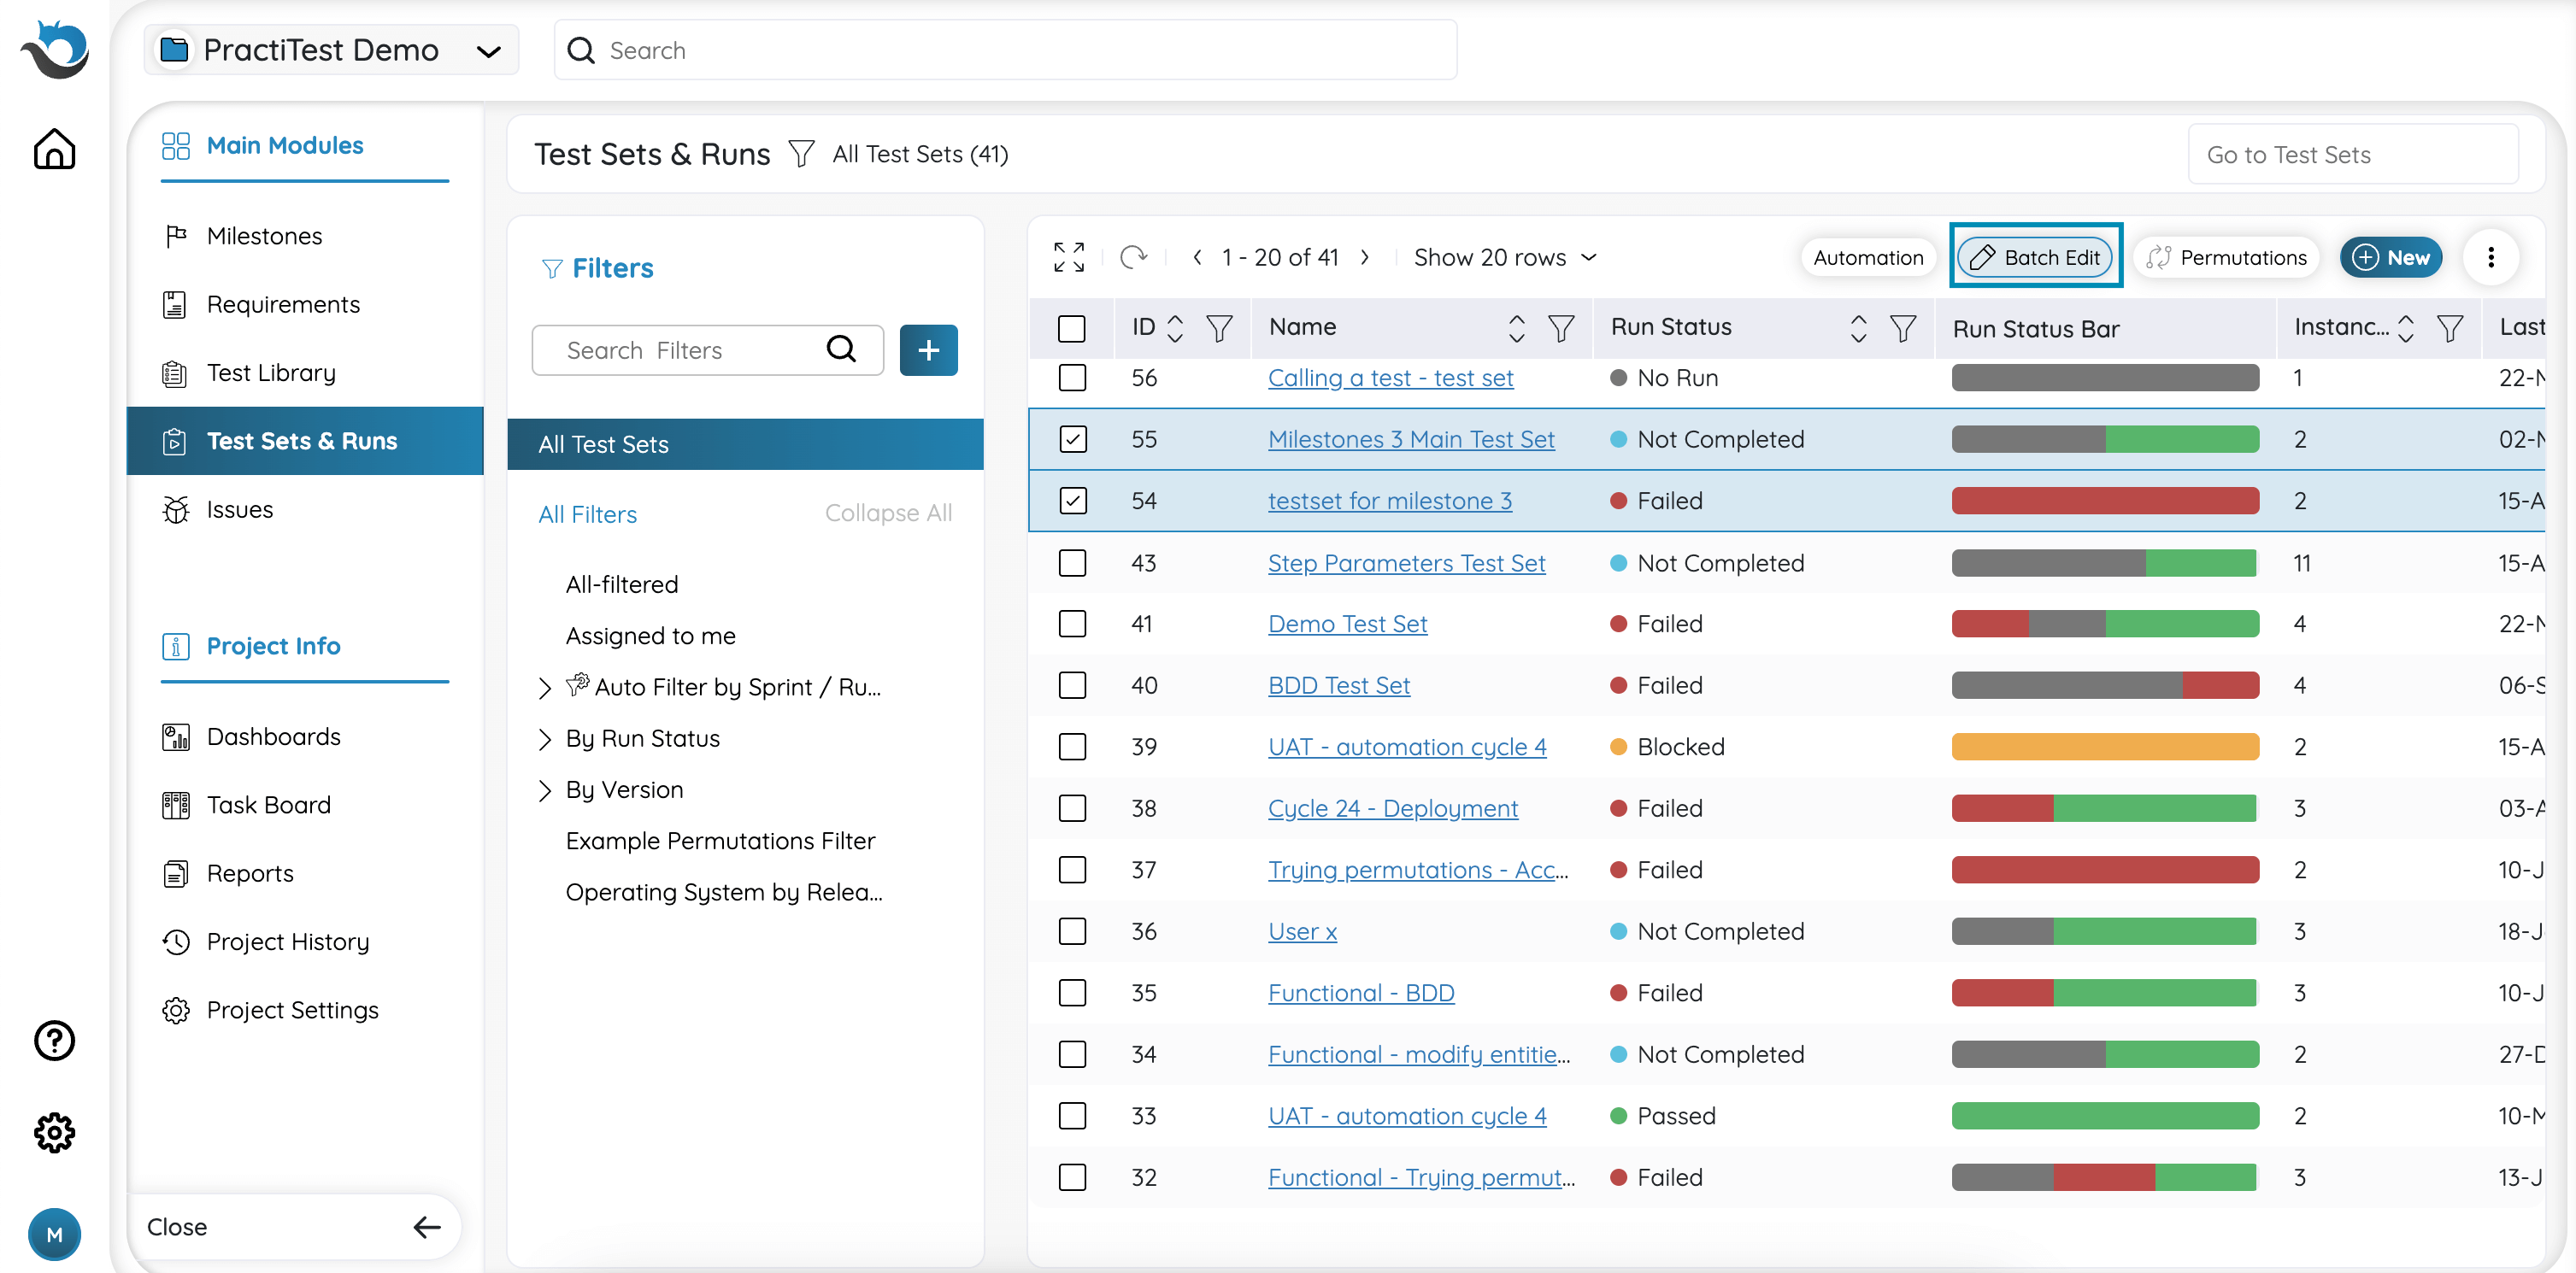
Batch Edit Fields
To edit multiple test sets simultaneously, select the Test Sets you would like to edit using the checkboxes on the left side of the grid, then click the ‘Batch Edit’ button at the top of the grid. The changes you make will apply to all test sets you have selected.
You can add a comment to the updated test sets and enable / disable email notifications of this batch edit.

Batch Clone - Clone and Modify One or More Entities in a Single Action
In the grid, select the Test Sets you want to clone, click on the three-dot button, and then choose ‘Clone’.

In the next window, you can modify fields of the cloned test sets, add a comment, create a new filter in the grid view, and enable / disable email notifications of this clone. You can also clone the selected Test Sets to a different PractiTest project. In this case, if you want to clone the values of custom fields, the target project must have the same equivalent fields with the exact names.
