This article explores the territory around metrics and measurement of software QA and test activities. Measurement and metrics are a key aspect of software QA and testing. Everything done in software QA is eventually understood by the way those activities are reported, which is primarily conveyed in metrics.
However, there are dangers in how people may misapply the information conveyed in metrics. By understanding the benefits, challenges and dangers of metrics, the value of software QA and test activities can become evident to everyone in the organization.

Introduction
The fundamental activity of software testing is measurement, such as knowing how many tests have passed compared to how many tests have failed. Ultimately, all the things you learn about the items you are testing culminate into information provided to stakeholders so they can make informed decisions, such as when to release an application.
However, many software QA and test professionals tend to focus more on how tests will be performed as opposed to the real information revealed by the tests.
A common example of this is the satisfaction seen when all the tests have passed. But, is this always a good thing?
For example, what if you have a one hundred percent pass rate, but the tests are weak? While all the green on the dashboard might look nice, it may actually be deceiving.
Table Of Contents
- Words of Caution Regarding Metrics
- Why Test Metrics are Important
- An Important Distinction
- The Key Activities in Software QA Metrics
- Final Thoughts
Words of Caution Regarding Metrics
Before diving into the larger discussion of QA and test metrics, it is important to understand that both measurement and metrics can be abused in a number of ways. One example is when metrics are manipulated to make a situation seem better or worse than it really is.
Another abuse of metrics is to use them as the only criteria by which to judge someone’s efforts. Numbers alone don’t tell the full story. Plus, once people learn how they are being measured, they will start to deliver more of whatever that thing is – and that is often not a good thing.
People tend to conform behavior to meet certain metric-based goals. For example, if testers are rewarded on how many defects they find, you may see the reported defect count skyrocket. Some people may have high numbers because they are reporting many trivial defects – some which may not be defects at all.
Others may have just a few reported defects to their credit, but those few defects might have much higher severity. In this case, the person with fewer defects is actually having a greater impact on the overall quality of the product.
High defect counts just to push the measurement higher is not a good thing. That’s because each defect report carries with it a cost to report, investigate, fix and re-test. Plus, you are adding to a pile that developers will start to find very annoying.
Certainly, as software testers and QA professionals, we want to find defects before the customers and users experience them in the real world. At the same time, we must understand that not every reported defect carries the same weight.
Finally, it is possible and in fact, common, for people to go overboard with measuring things. The danger here is that the important information gets buried in the clutter of too many metrics and it gets missed. Plus, too much focus on metrics distracts from other important tasks.
So, be careful in how you handle measurements and metrics!
Why Test Metrics are Important
Going back to the idea that the main activity of software testing and software QA is evaluation and measurement, metrics are not just an optional aspect of what we do as software quality practitioners. In reality, measurements and metrics are the end result of what we do in software QA and testing.
Tom DeMarco has been famously quoted as saying, “You can’t control what you can’t measure.”
Software testing is quality control (QC) for software. Testing is also a control used to detect defects in the context of financial systems, medical devices, and other safety critical applications. What we do in software testing is essentially the data needed to control the quality of systems. Therefore, that quality must be measured.
Software QA is the management of software quality. QA relies on measurements and metrics to know:
- How well processes, even agile methods, are performing
- Where improvements can be made
- The nature of defects being discovered and how they are being found
Some evaluations of software are subjective, such as usability. However, there are ways to quantify usability such as the time taken to perform a task. Even when dealing with defect data that can be very objective, people may not fully understand the significance of defect counts until they truly understand what the users will experience.
Other evaluations of software are objective, such as system performance metrics such as response times under given load conditions. Another form of objective metrics, defect metrics, helps provide understanding of where the defects are in an application, but more importantly, the root cause of how those defects came to be created in the first place.
Finally, if you want to get good at test estimation, get good at measuring what you do in testing. Your past experiences in testing certain types and sizes of projects are often a helpful guide in estimating future testing efforts.
An Important Distinction
“Measurements” and “metrics” are two terms that are often interchanged, but the terms have different meanings.
A measurement is a single dimensional aspect of something. Basically, a measure is a count or some assessment based on a standard. Examples are:
- The number of defects in a test cycle
- The number of requirements defined for a function
- The number of hours spent in an activity
A metric is determined when two or more measurements are used together to compute a value. Examples are:
- Defect density – The number of defects per function or some other baseline (e.g., function points, requirements, user stories, etc.)
- Defect detection percentage (DDP) – The number of defects found either by a particular group or the entire releasing organization, divided by the total number of defects found over the life of the release.
The problem with measurements is that they often fail to convey context. Let’s say that we are comparing two projects.
Project “A” has 100 reported defects, while project “B” also has 100 reported defects. If you were asked to evaluate which project had higher quality based on the data provided, you could not reasonably do it. Or, you might assume that both project were equal. But is that a valid assumption?
What if you learn that project “A” had 100 distinct functions and Project “B” had 200 functions? That would give project “A” the defect density of 100% and project “B” would have 50%. So, it would appear based on defect density, that project B is of higher quality.
Now, let’s say that you examine the reported metrics and learn that in the 100 reported defects in project “A”, 80% were minor and 20% were major. In project B, you learn that it is just the opposite, 80% of the defects were major and 20% were minor. That would cause you to think project “A” is of higher quality.
This quick example shows how important it is to consider the context of the measurement or metric, and to understand that these two evaluations are strongly related, yet different in meaning.
The Key Activities in Software QA Metrics
With the above understating, let’s look at the key activities in software QA and testing metrics.
Definition
Understanding what to measure may be the most difficult task in the whole metrics effort. We want to measure the things that have value not only to us, but the stakeholders we serve.
But, as William Bruce Cameron stated, “Not everything that counts can be counted”. (1963, Informal Sociology, a casual introduction to sociological thinking by William Bruce Cameron, Page 13, Random House, New York).
That should serve as a reality check.
Some of the common major areas of QA and test metrics include:
- Defects
- Time expended in a given activity
- Test coverage (such as the percentage of user stories covered by tests)
- Risks (levels and status of risks)
It’s important to understand that every metric needs a “why”. There should be a reason for each measurement or metric you want to obtain. If you can’t provide this justification, then you need to rethink the need for the metric.
Also, metric definition shouldn’t be done in isolation. It’s very important to ask the stakeholders which information they value from QA and testing efforts. Then, you may need to iterate with the metrics to see if they actually convey what is desired.
One of the best approaches I use in defining metrics is the Goal-Question-Metrics (GQM) approach.
In this approach, you define the major goal(s) you want to achieve. Then, you define the questions you need to ask and answer in order to meet the goal. Finally, you define the data you will need to answer to answer the questions. These are your measurements and metrics (Figure 1).
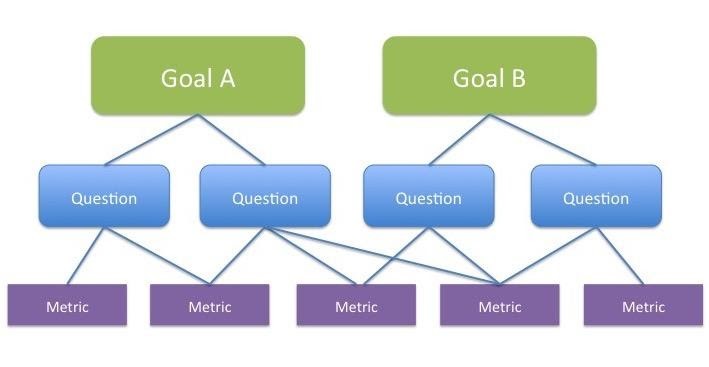
Figure 1 – The GQM Approach
As an example, let’s say you define a goal to reduce defects found by customers by 50% by the end of the year.
Some questions to ask and answer might be:
- How many defects are currently being found?
- How severe are the defects?
- Where do the defects originate?
Some metrics to help answer the questions are:
- Defect severity
- Defect detection percentage
- Defect discovery rate, post-release
- Defect origin by project activity
Desirable attributes of a metric
Here is a short list of what makes a good metric:
- Simple – It can be easily measured and understood
- Can be automated, so we don’t have to take readings manually, this is also needed so that people don’t get the chance to manipulate the numbers
- Meaningful – So that stakeholders can gain useful information to make decisions
- Actionable – So that appropriate actions can be taken on the information gained from the metric.
Common software QA and test metrics include:
-
Test Coverage
- Requirements
- Functional
- Test case
- Code coverage (such as statement, decision outcome, multi-decision and path coverage)
-
Test Status
- Testing
- Defect resolution
- Readiness for deployment
- Pass/Fail
-
Progress
- Based on test goals and objectives
- Blockages
-
Risk
- Technical
- Business
- Project
-
Defects
- Categories
- Trends
- Detection Percentage
- Resolution Status
-
Testware
- Completion %
- Automation %
-
Resources
- Time expended in QA/test tasks
- People needed for QA/test tasks
Implementation
Now that you have a list of metrics to start with (hopefully a short list), it is time to give thought as to how to obtain and report them.
Automation is the only practical way to obtain the data needed for metrics. For many years in the software QA and testing profession, as well as in software development, people had a difficult time measuring things because it simply took too much effort and was too error-prone.
Thankfully, today there are great tools such as PractiTest that report the metrics you need as part of the test reporting dashboard (Figure 2).
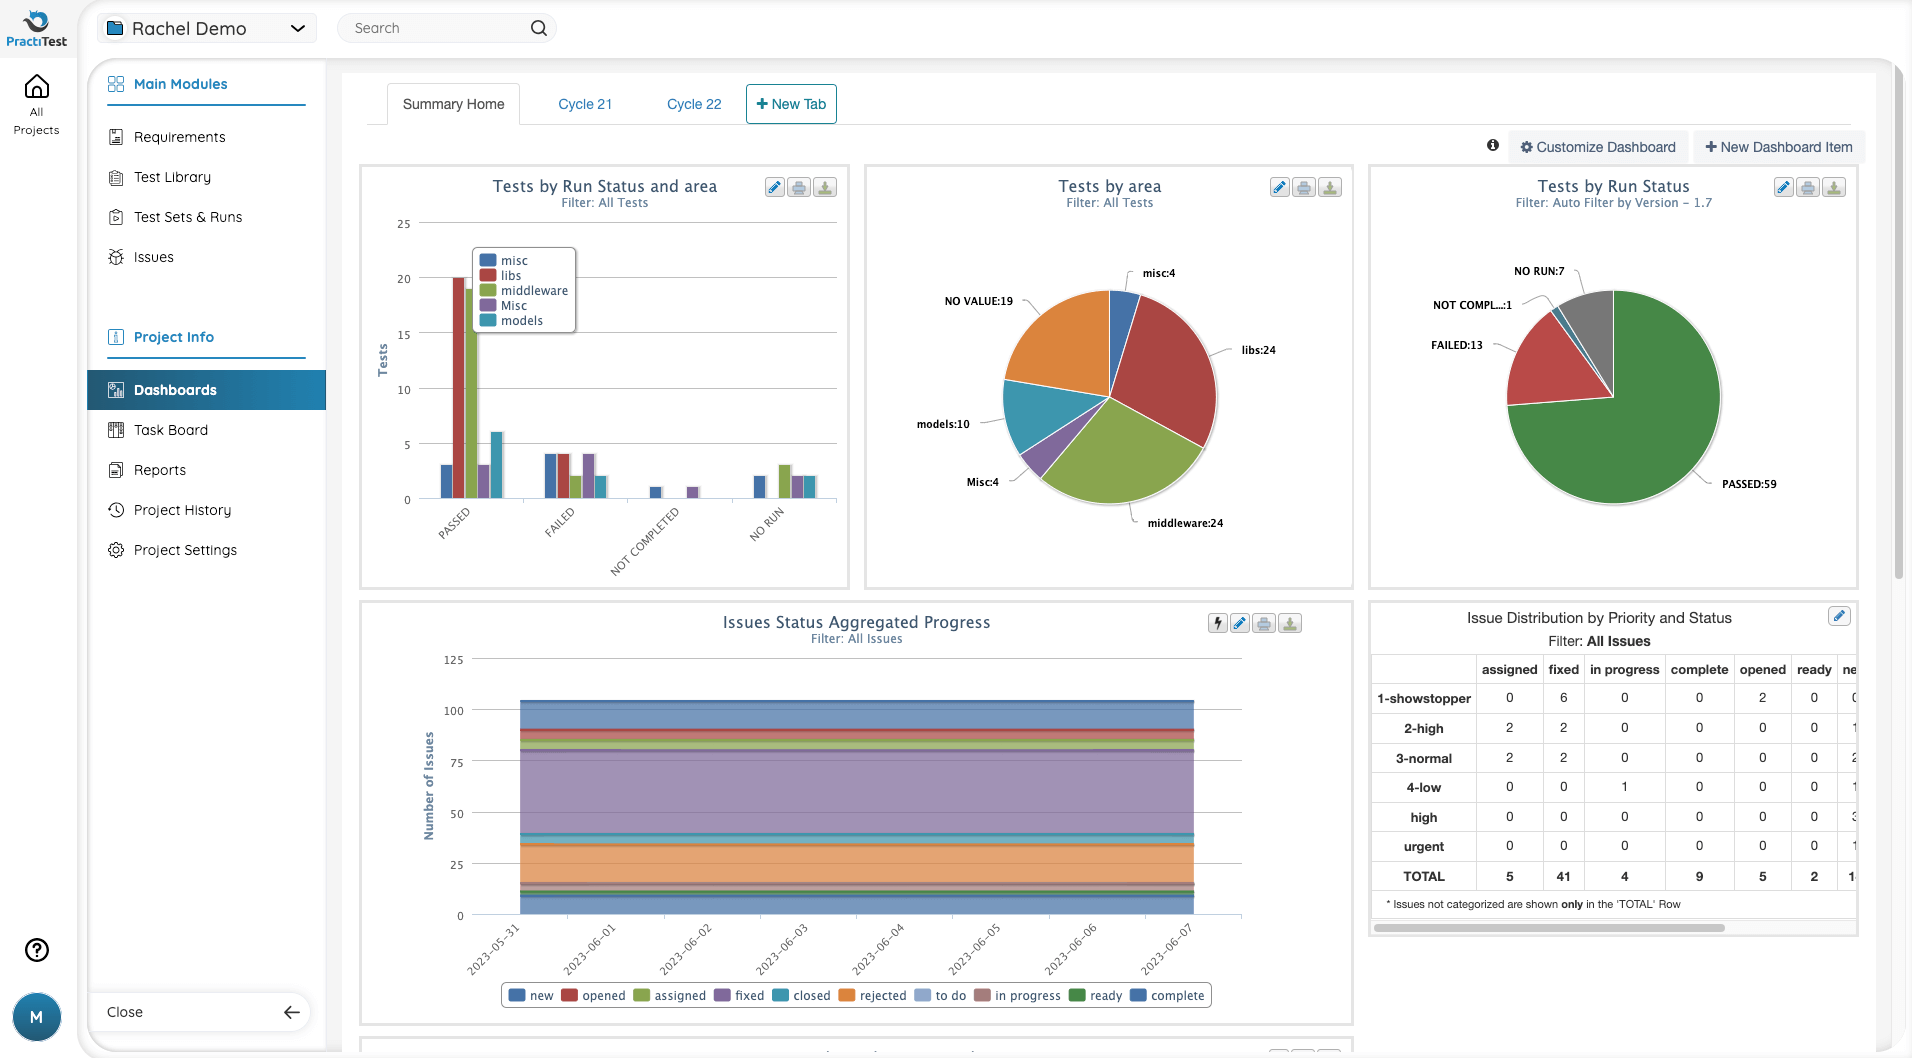
Figure 2 – Sample QA Dashboard in PractiTest
Like metrics, dashboards have also traditionally been a challenge for people to create and maintain. Thankfully, today we don’t have to create cumbersome spreadsheets from scratch. The great value of test management tools like PractiTest is that they give visibility to the rest of the organization regarding the status of testing on any project in real-time.
Gaining Understanding
When dealing with QA and test metrics, a key question to ask often is “What does this information mean”.
As an anecdotal example, once I was tasked with creating a dashboard for a client. One of the metrics reported was a very common one, the pass/fail rate of the tests.
At one point in the project, the pass rate as shown on the dashboard was 98%. One stakeholder was happy that many of the tests had passed. However, another stakeholder was very concerned that the tests were not failing enough – an indication that the tests might be too weak. I had to admit, there were great points on both sides.
We had to refine the metric to be understood as the eventual pass/fail rate with the understanding and display of data that showed how the pass/fail rate changed over the course of testing. Certainly, management did not want to release the software with a low pass rate.
One other thing to understand about metrics is that the reliability of any measurement or metric is based on the reliability of the underlying data. If you can’t trust the source of the data, you can’t trust the things based on that data. This is why obtaining metrics through tools is preferable to manual methods.
Taking Action
Unless action is taken based on the understanding gained from metrics, the time and effort spent on obtaining and reporting them is wasted.
Metrics can be used to know the status of software for release, but the greater value is to guide efforts to prevent similar problems in the future.
Also, metrics can form the basis for future test estimates.
Refinement
As you continue to keep and maintain metrics, you will find that they need to be refined to enhance accuracy and understanding. This is an important thing to remember because metrics and measurements are very dynamic in nature. As applications mature, so will the metrics needed to understand the quality and status of those applications.
Final Thoughts
In this article we were only able to scratch the surface in understanding software QA and testing metrics. However, with the concepts covered, you should be equipped to know what to look for in a test management tool with regard to metric gathering and reporting – and how to use those metrics in guiding your testing projects.
Keep in mind that metrics are measurements in context. While measurement such as defect counts are important, they often fail to convey the true picture of quality until seen in relationship to other measurements, such as scope and time.
Also remember that while metrics can be a way to understand the status of testing, it is up to you to take the right actions with respect to the information gained from the metrics.
By Randall W. Rice
Published on:
Randall W. Rice, CTAL
Randall W. Rice is a leading author, speaker, consultant and practitioner in the field of software testing and software quality, with over 40 years of experience in building and testing software projects in a variety of domains, including defense, medical, financial and insurance.
You can read more at his website.