- Overview
- Report Types
- Creating & Editing Reports
- Report Samples
Reports are an essential part of the testing process. PractiTest’s Reports module helps you create detailed reports with predefined templates and takes advantage of the filter and field customizations you already use as part of your regular process.
The Report Module offers unique options:
- Schedule reports on a daily, weekly, or monthly basis
- Decide which users will receive the report by email
- Modify report columns and graphs according to your needs
- Rerun a report instantly with one click
- Redefine report criteria and rerun the new criteria on the same data retroactively, at the time it was originally run
Overview
To access your existing reports or create new ones, click the reports menu item from the settings panel on the left.
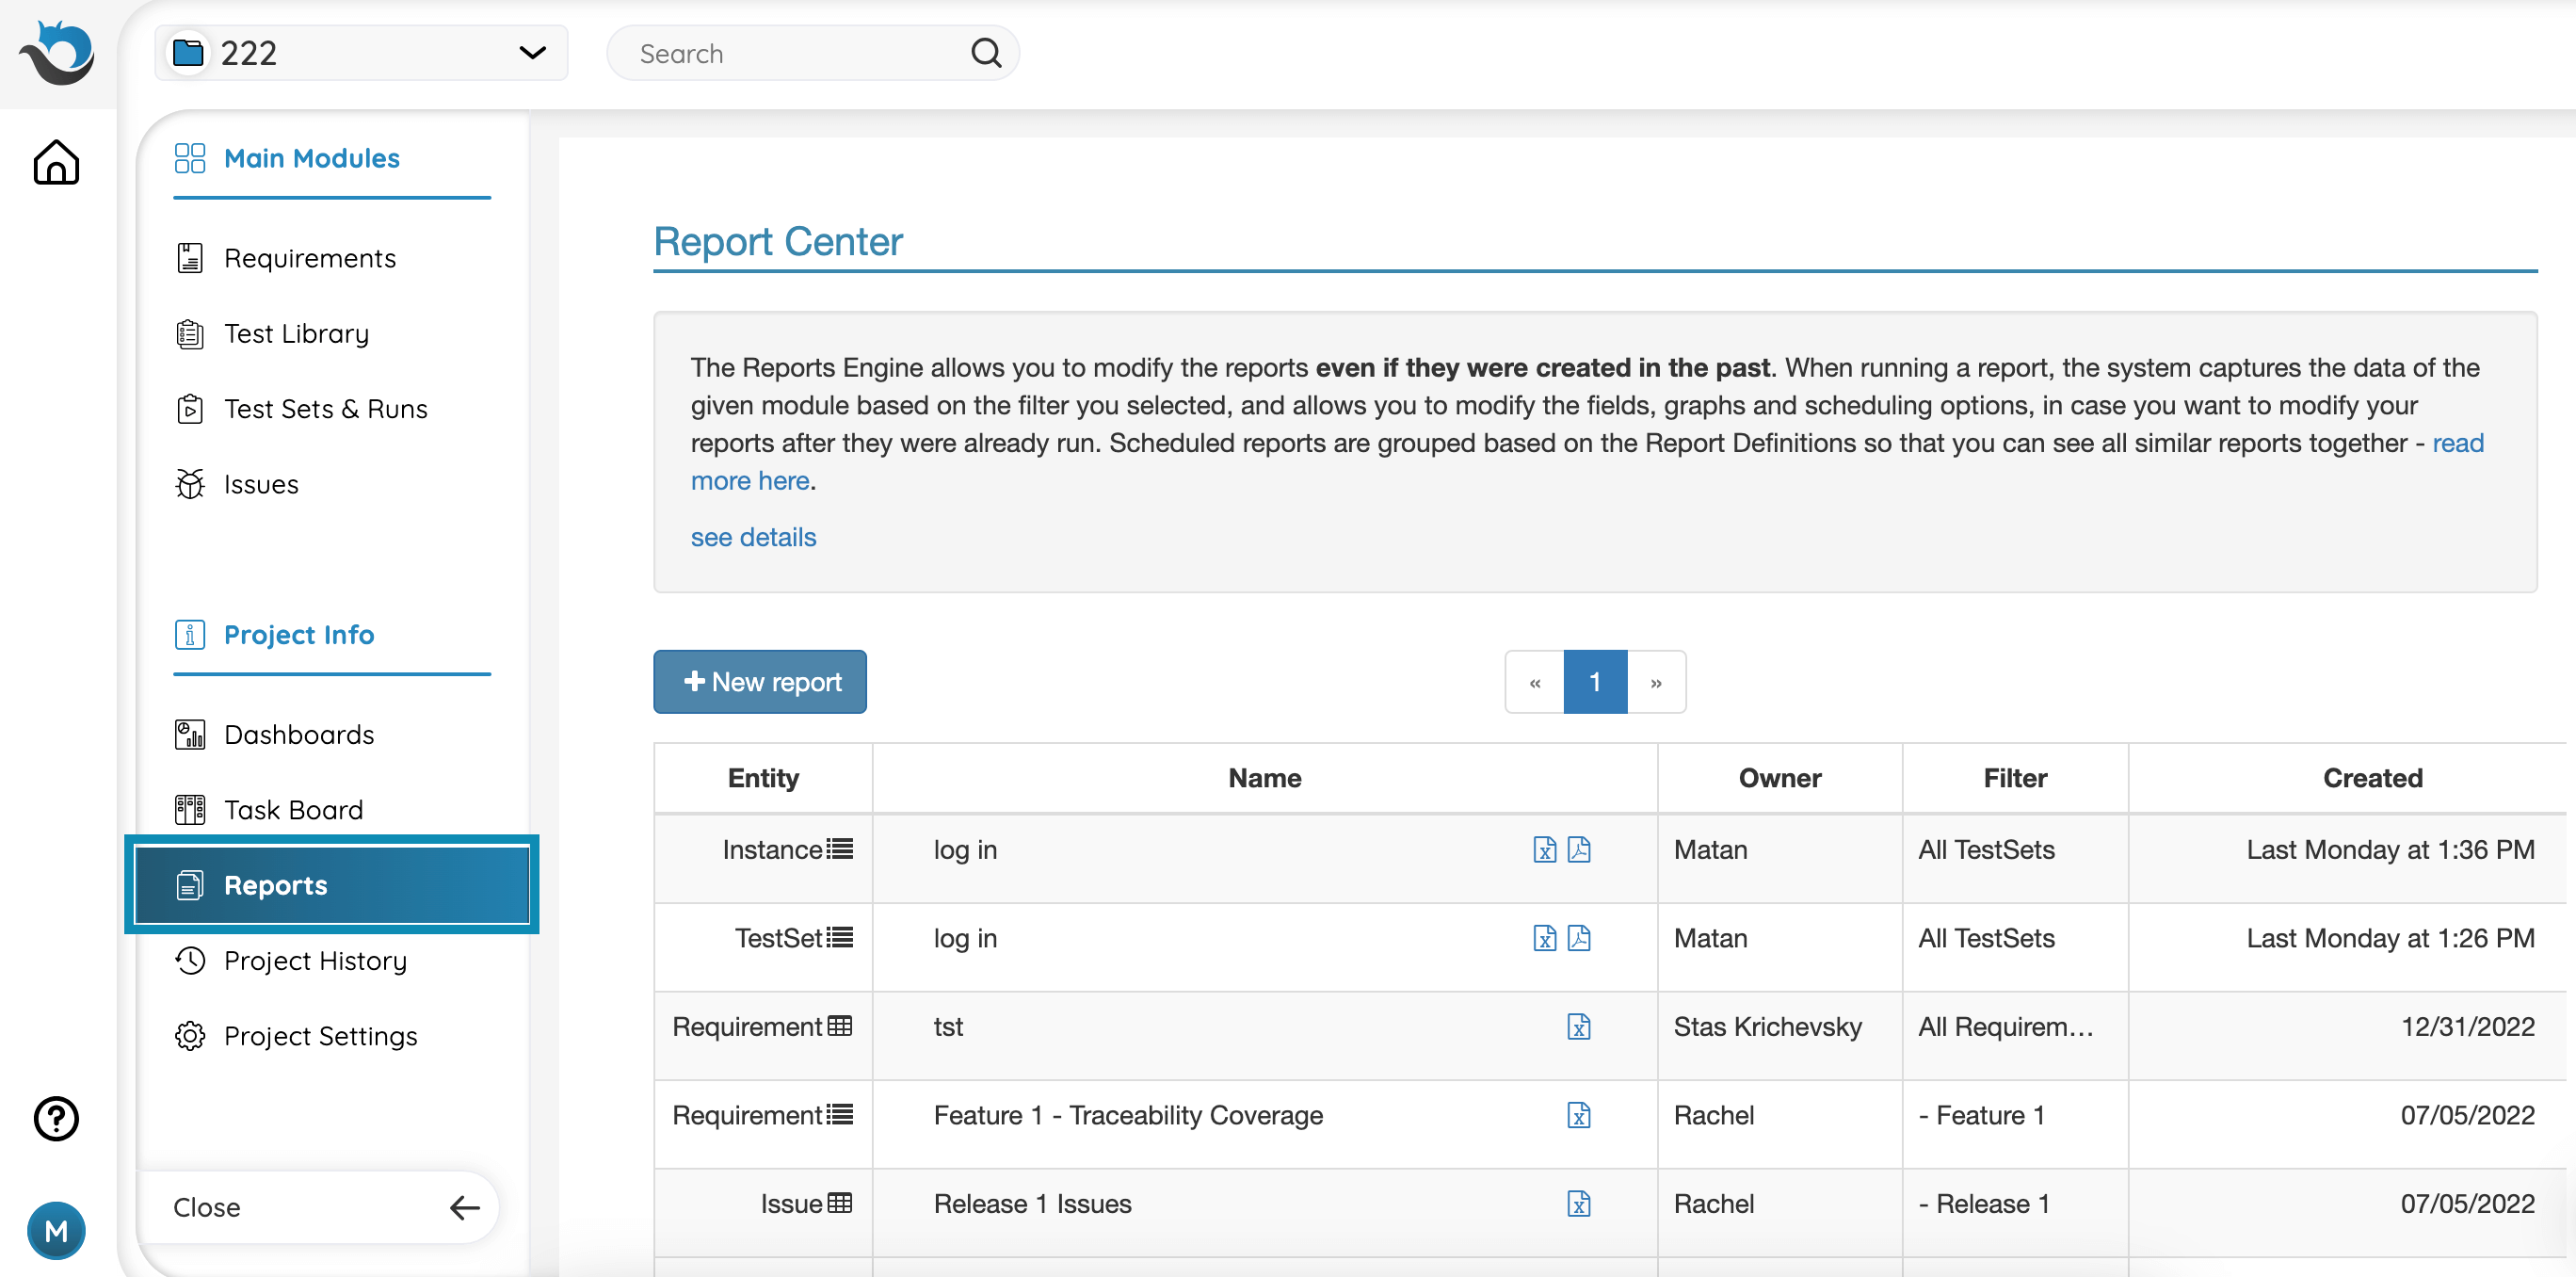
Once in the Report Center, you can see all the reports already available in your project.
For each report, all relevant information is displayed. For example:
- Entity (Requirement/Test/Test Set/Instance/Issue/Run) and report type
- Name
- Report format (Excel and PDF)
- Report owner (author)
- The filter used to create the report
- Created
- Actions
There are several options in this section:
![]()
- The lightning icon - reruns the report on the latest data. When clicking this option, the old report will be saved under the new one as shown below.
- The cloning icon - duplicates the report
- The edit icon - edits the report
- The trash can icon - deletes the report
After making modifications to a specific report definition, the previously run versions of this report will display a new cycle icon next to them. By clicking this cycle icon, you can rerun the report with the newly edited definitions, but based on old data (at the time they were created).

Creating a new report stores it for future reference. This means that you can create reports not only to display the current status of your project, but also to serve as snapshots to be accessed for future reference and auditing.
Report Types
You can generate reports for each of your entities (ie. Issues, Tests, Test Sets, Instances, and Requirements) and based on 4 different templates. These provide detailed perspectives of your project.
- Tabular Report – displays a data tab with information based on the selected filter, with a summaries tab including charts to illustrate the data.
- Detailed Report – provides information for the entities based on the chosen filter.
- Tabular With Steps (available for Tests and Test Instances – a tabular report for tests including step names, descriptions, and expected results in the data tab, a summaries tab including charts to illustrate the data, and an issue tab including issues information based on the scope of the report.
- Tabular Aggregated Report (available for Instances and Runs) – provides information for tests across multiple test sets based on any list fields in your test instances.
- Tabular Traceability Report (available for Requirements only) – provides a traceability overview, coverage of requirements by tests, test sets containing each test, and issues that were created from each test instance.
Creating & Editing Reports
After clicking the ‘New Report’ button, the screen below will appear:
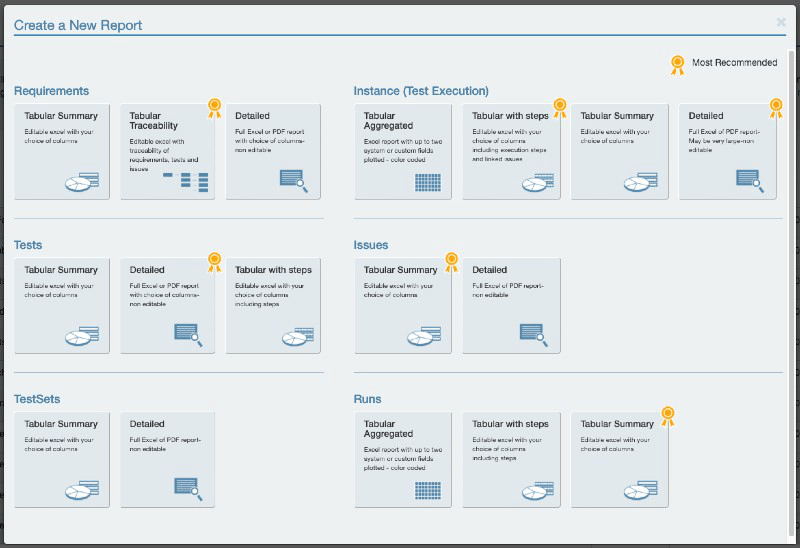
Choose the entity for the report (ie. Issues, Tests, Test Sets, Runs, Instances, or Requirements) and the type of report you want to generate (ie. Tabular, Tabular with Steps, Detailed or Tabular Aggregated).
After choosing a report, a window will open that includes a description of the report. For example, this is the description for the Requirement Traceability Report:
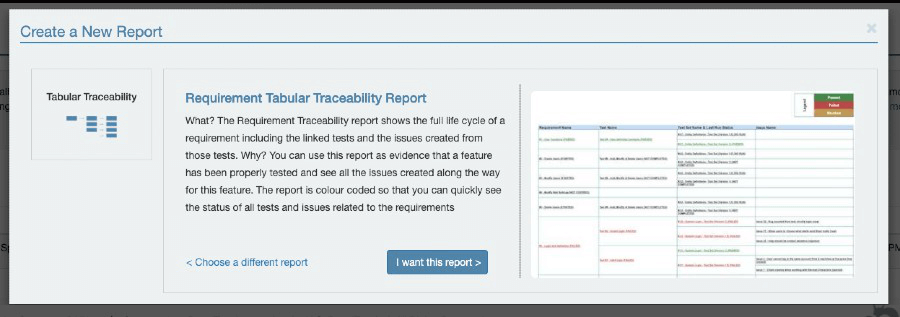
If this is the report you intended to create, click “I want this report”. If you selected a report by mistake, click “Choose a different report” to return to the previous screen.
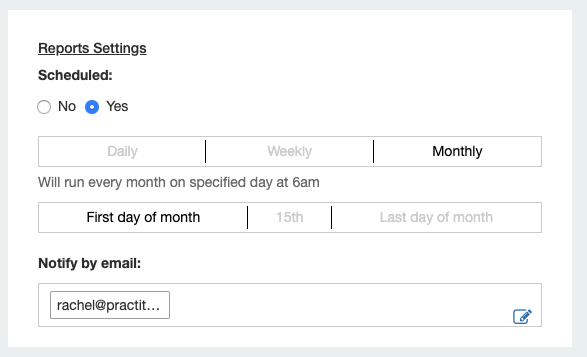
When creating or editing reports, you can schedule them to run on a daily, weekly, or monthly basis and determine who should be notified when the report is ready. This can be done in the “Report Settings” section.
Give a name to each report; it will help you remember the information stored in it. Avoid using generic names such as “Issues Report” since it may be difficult for you to remember in the future and other people may be unable to differentiate between your existing reports.
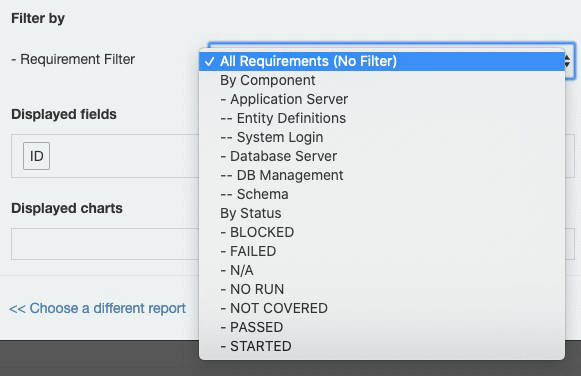
After choosing your report, you can then customize it. First, choose the filter you want to use on your data.
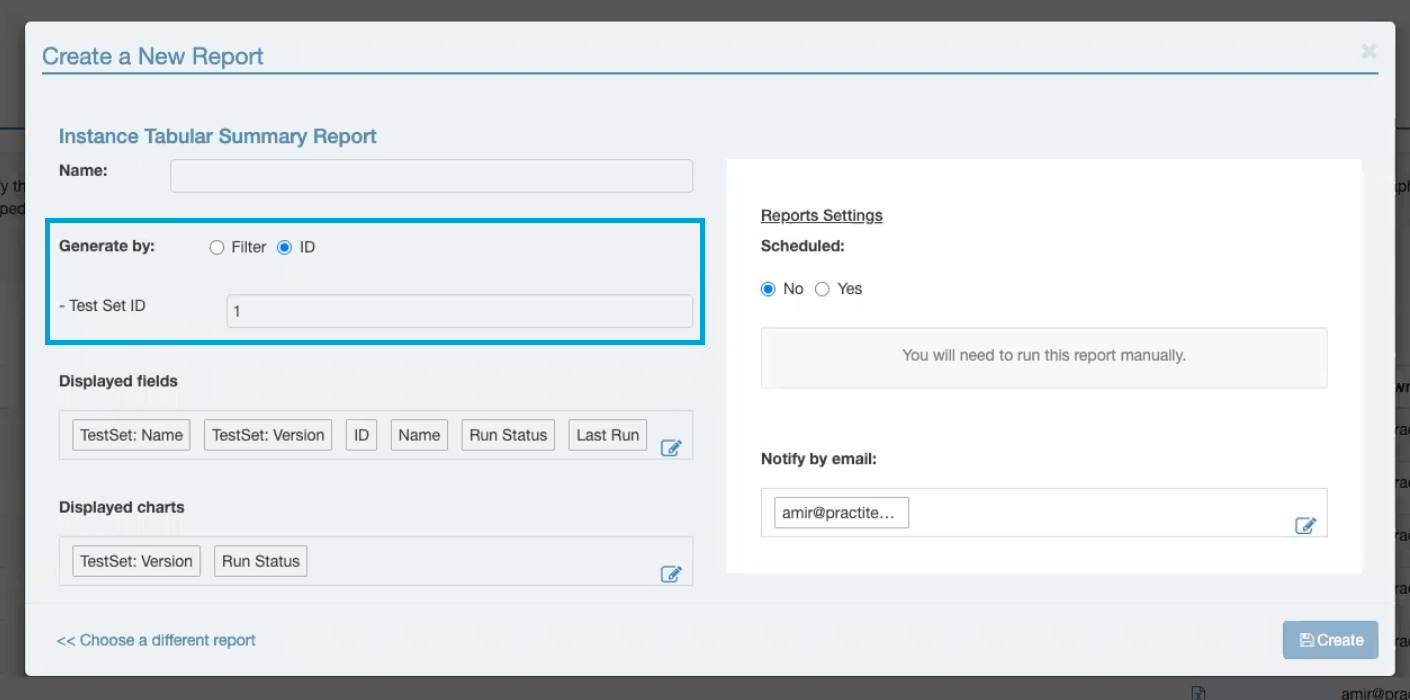
If you are creating an Instance Tabular Summary Report, you can base your report on a specific Test Set by choosing its ID:
To base your dashboard graph on a specific Test Set in all other reports, follow the instructions here.
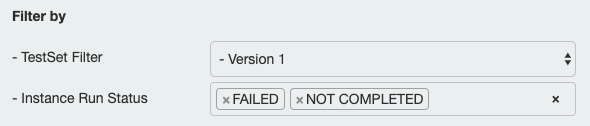
When creating a report for an Instance entity, you will be able to select an additional filtering option to filter by Run Status.
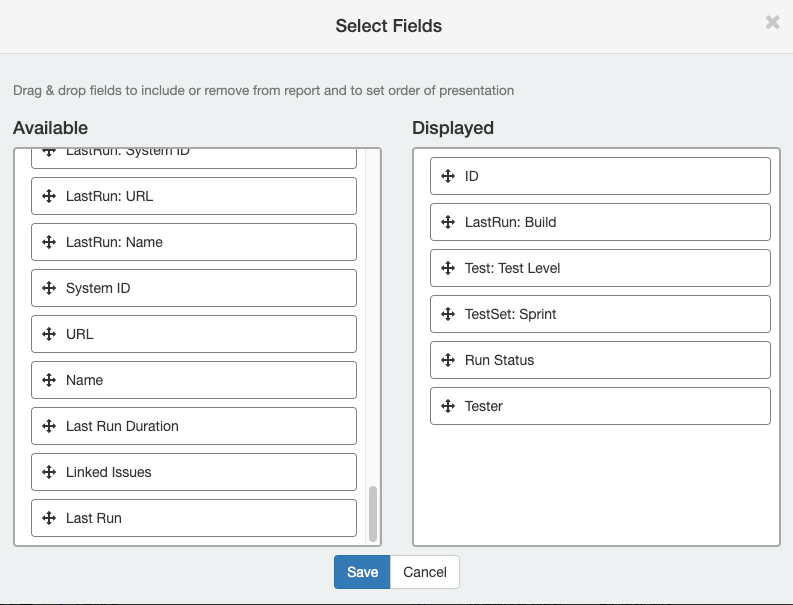
In Tabular reports, you can choose the fields, charts, and include URLs for each entity in your report.
Test, Test Set, and Last Run Fields in Instances Reports
When creating an instance report of the ‘Tabular’, ‘Tabular With Steps’, or ‘Tabular Aggregated’ types, you can select to show fields from the Test, Test Set, or Run level.
- Fields from the Run level will show the information based on the Last Run of the instance
- Test level fields will show the information from the field in the original Test in the test library
- Test Set level fields will show field information from the Test Set in which the relevant Instance resides
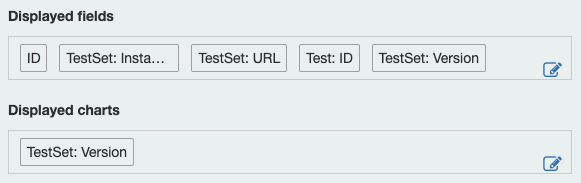
The following example is an Instance report of the Tabular Summary type. The selected fields are:
- The ‘Build’ field from the Run level
- The ‘Test Level’ field from the Test Level
- The ‘Sprint’ field from the Test Set level
From the Instances level, the selected fields are:
- ‘Run Status’
- ‘Tester’
- ‘ID’
As you can see from the example above, fields from different modules will start with the module’s name in the Instances report selection. The ‘Sprint’ field from the Test Set level shows as ‘TestSet: Sprint’, ‘Build’ field from the Run level will show as ‘LastRun: Build’, etc.
Report Samples
Let’s see examples for each report template in PractiTest, including a short description of the report settings and content.
Instances
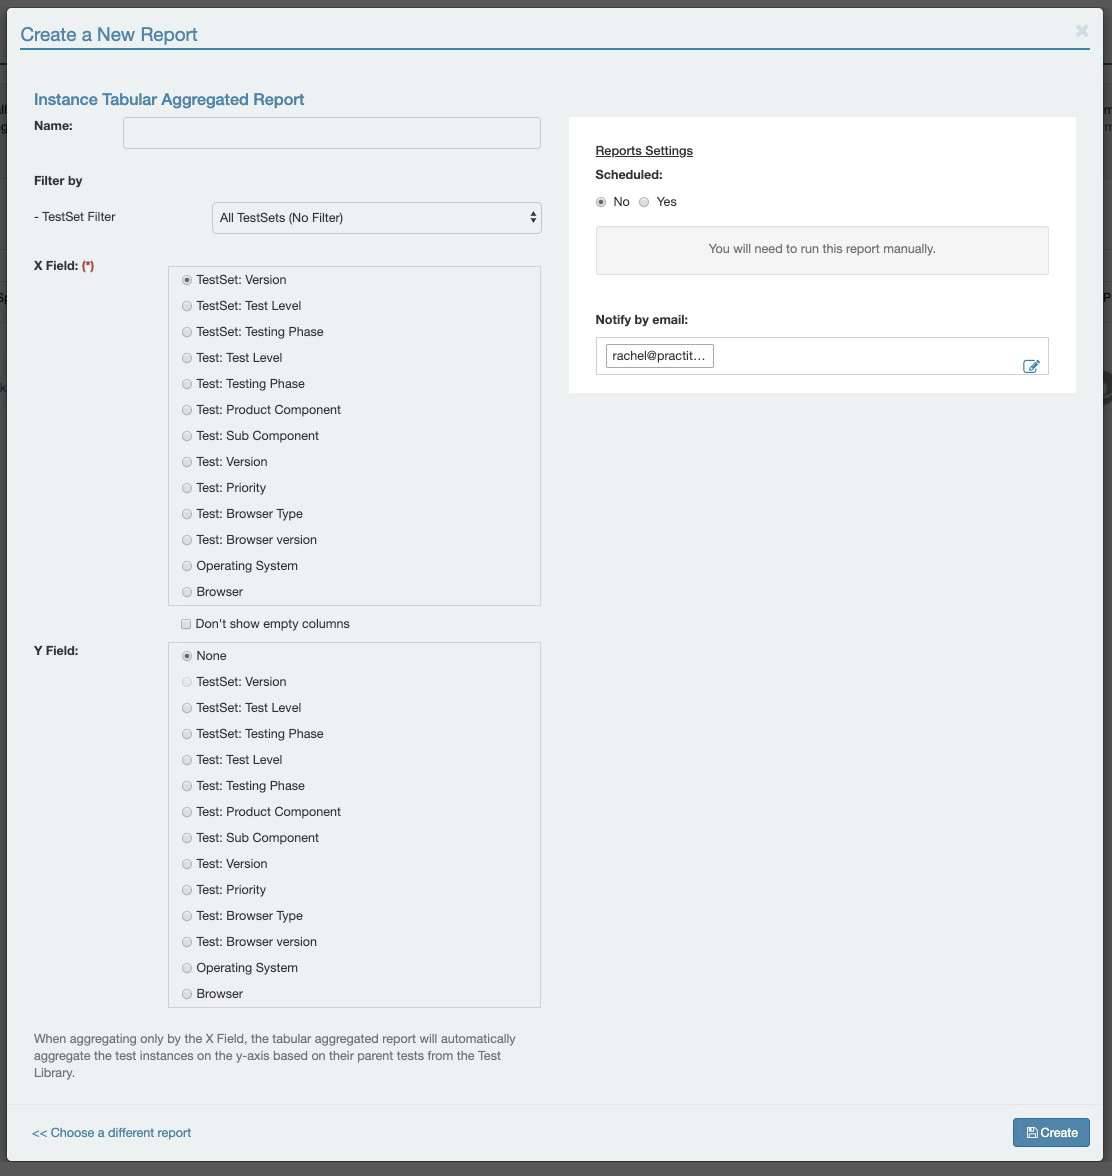
Instance Tabular Aggregated Report
The Tabular Aggregated Report can be created for two purposes:
- Compare aggregated results of the same instances over different runs.
- Analyze instances of aggregated results based on different parameters.
There are two preconditions to get this report:
-
The custom fields that you want to analyze in the report must be within your instances’ custom field (this is easy to do by using the Batch Edit button). Please see the image below.
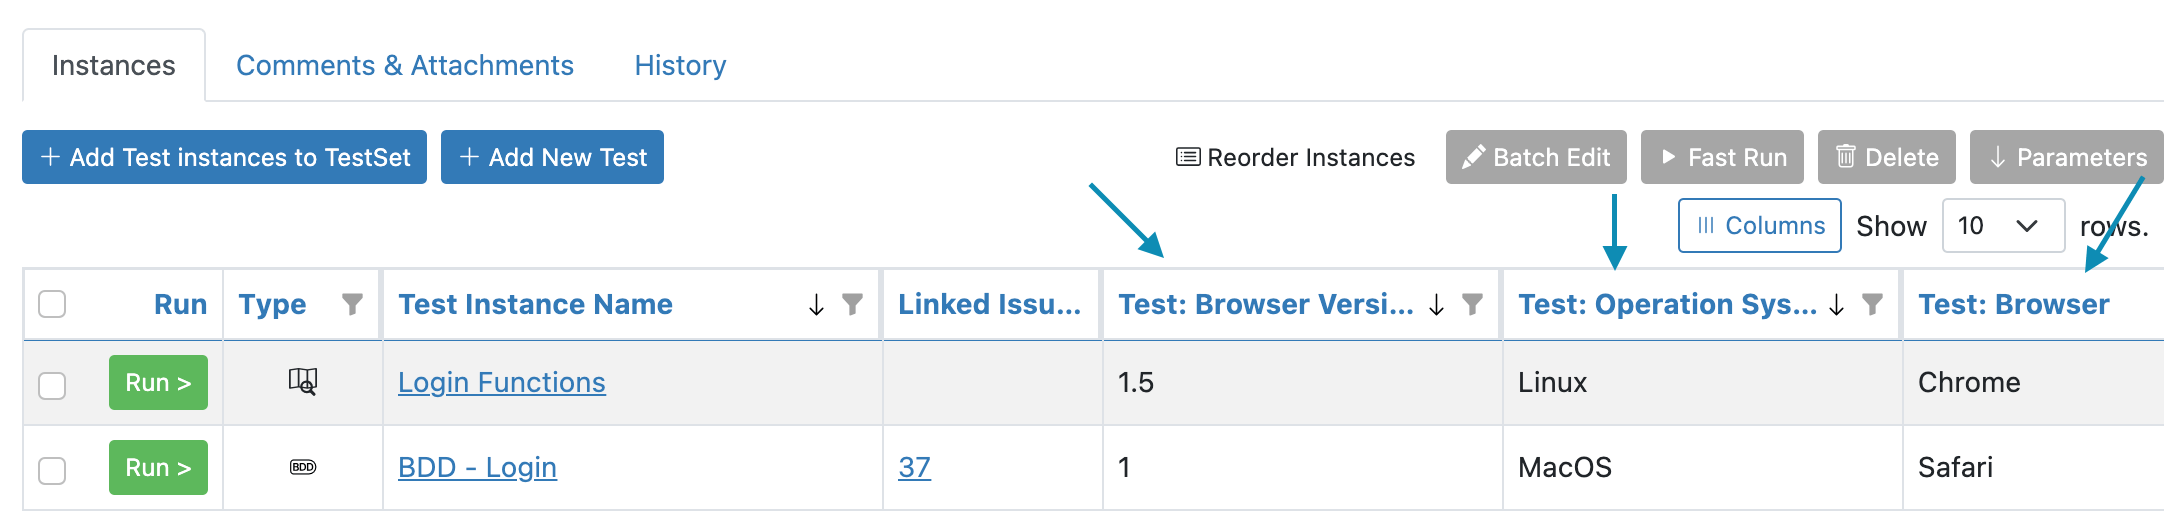
-
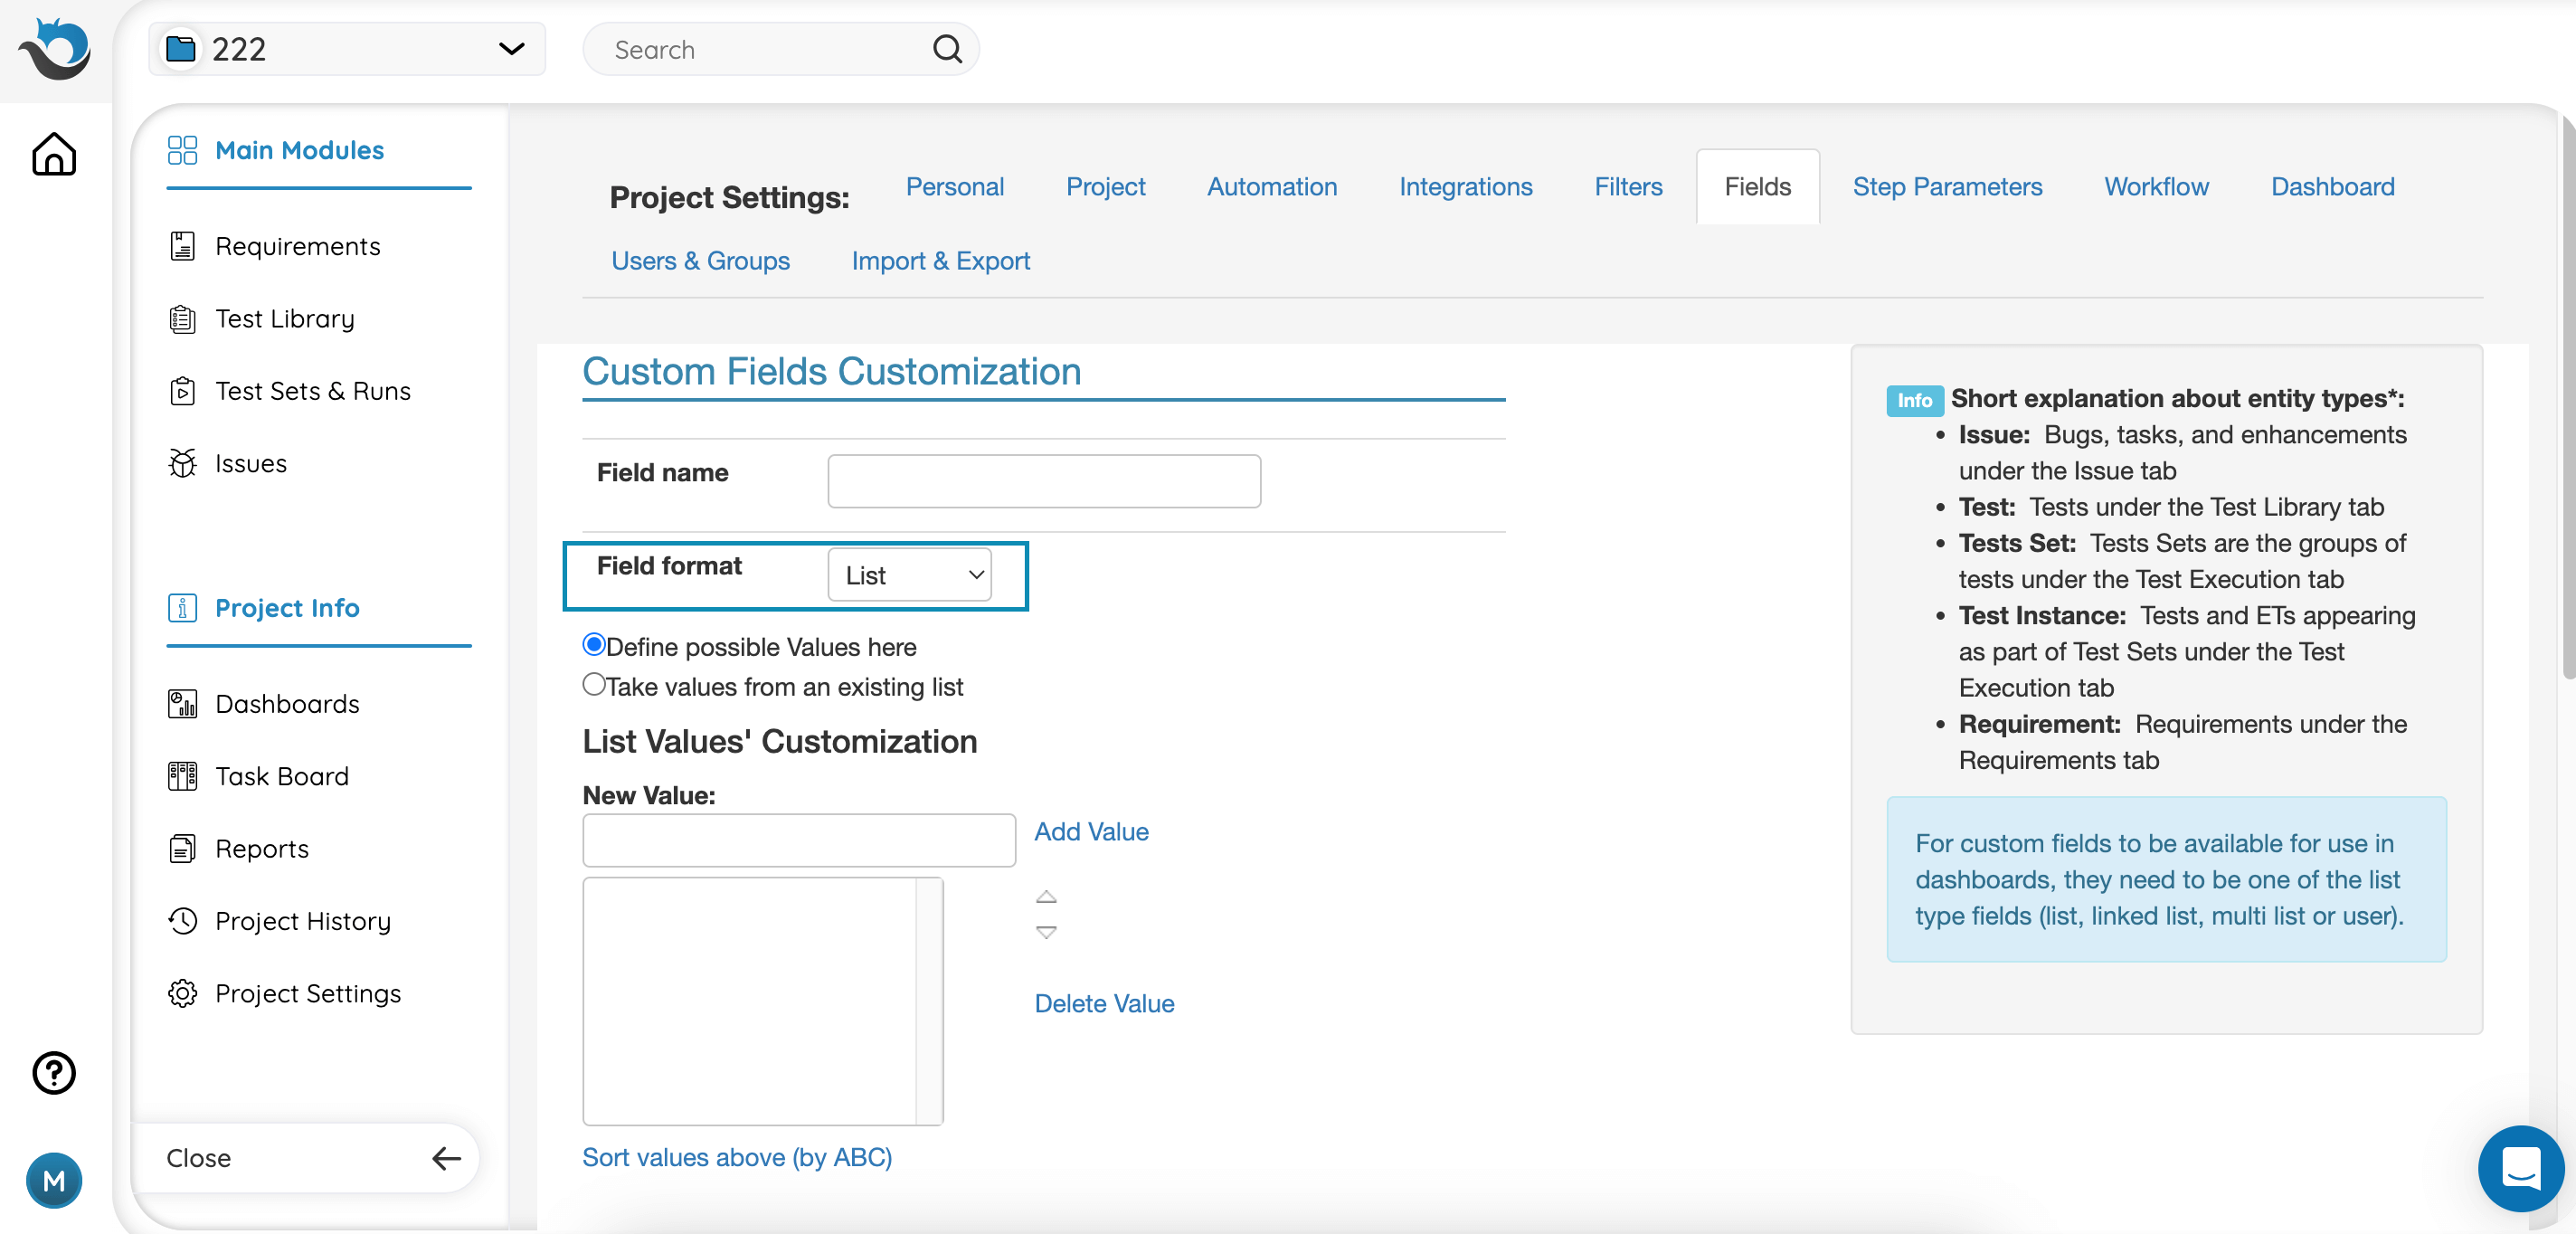
The custom fields format must be a List or Linked List type.
When creating a Tabular Aggregated Report, there are two options:
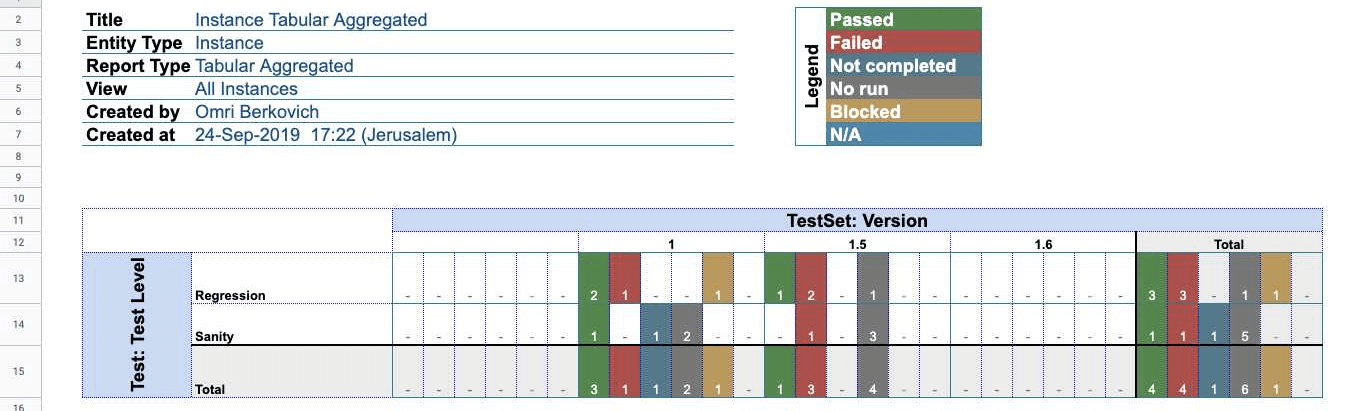
- You can create a report choosing X Field only. The report will automatically aggregate the test instances on the Y axis based on their parent tests from the test library.
- You can choose both X Field and Y Field. The report will aggregate the test instances based on both of these fields.
For more information on Tabular Aggregated Reports, please visit this page.
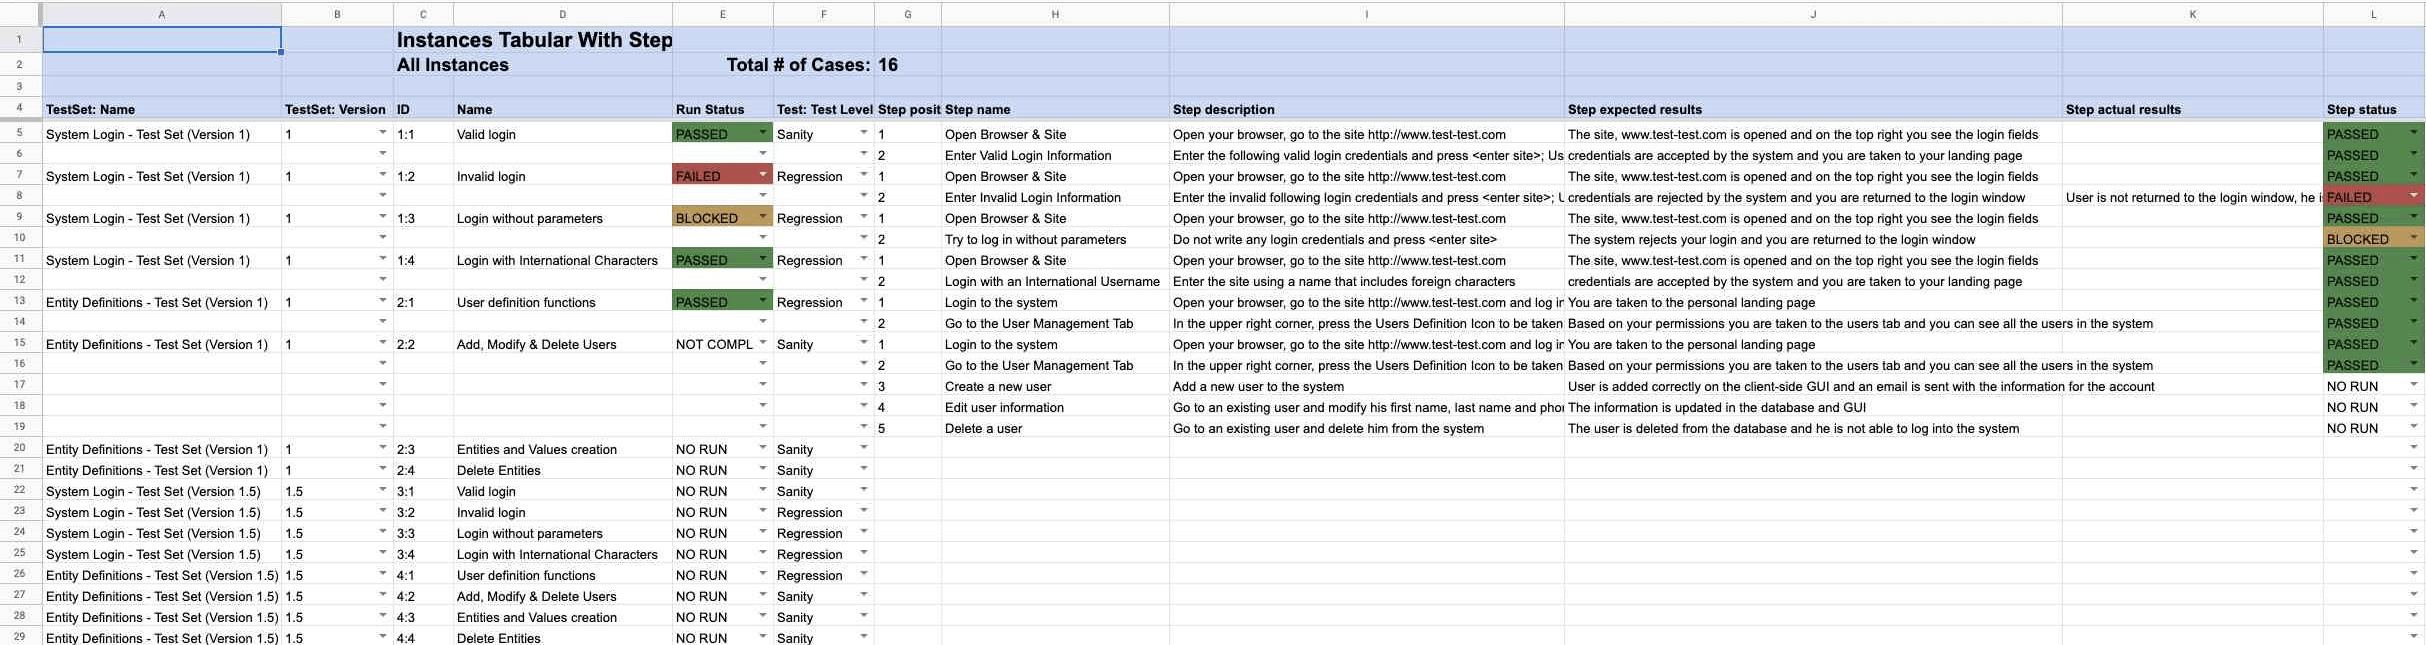
Instance Tabular With Steps Report
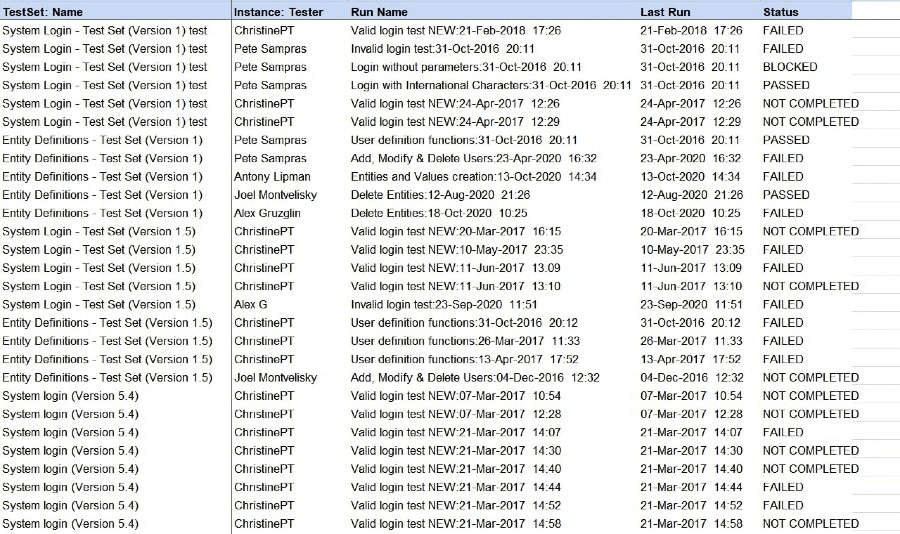
In this example, you can see the data tab of the report. On the other tabs, you can find charts (preselected in the report’s settings), and issues that are related to the selected test instances.
In the report settings, select the columns that should appear in the data tab, schedule the report, select the charts, focus it on a specific Test Sets & Runs filter, and decide whom to notify by email once the report is ready. Learn more about Tabular With Steps Reports here.
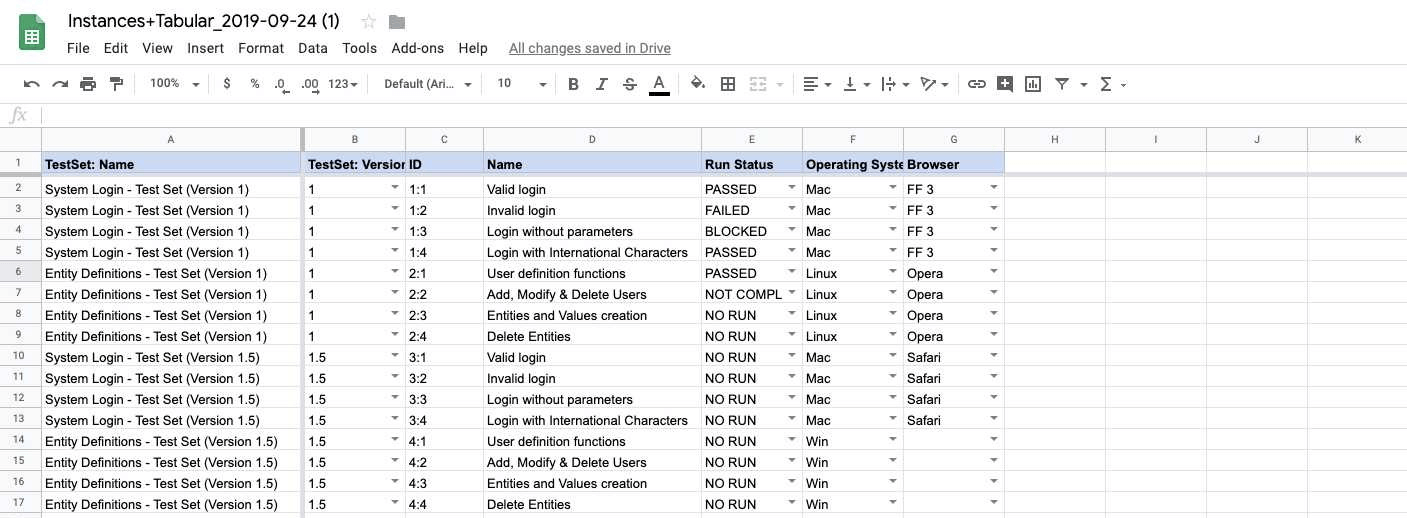
Instance Tabular Report
In this example, you can see the data tab of the report with the details you selected to appear in the report. On the summaries tab, you will see a visual representation of the report data.
In the report settings, select the columns that should appear in the data tab, schedule the report, select the charts, focus it on a specific Test Sets & Runs filter, and decide whom to notify by email once the report is ready.
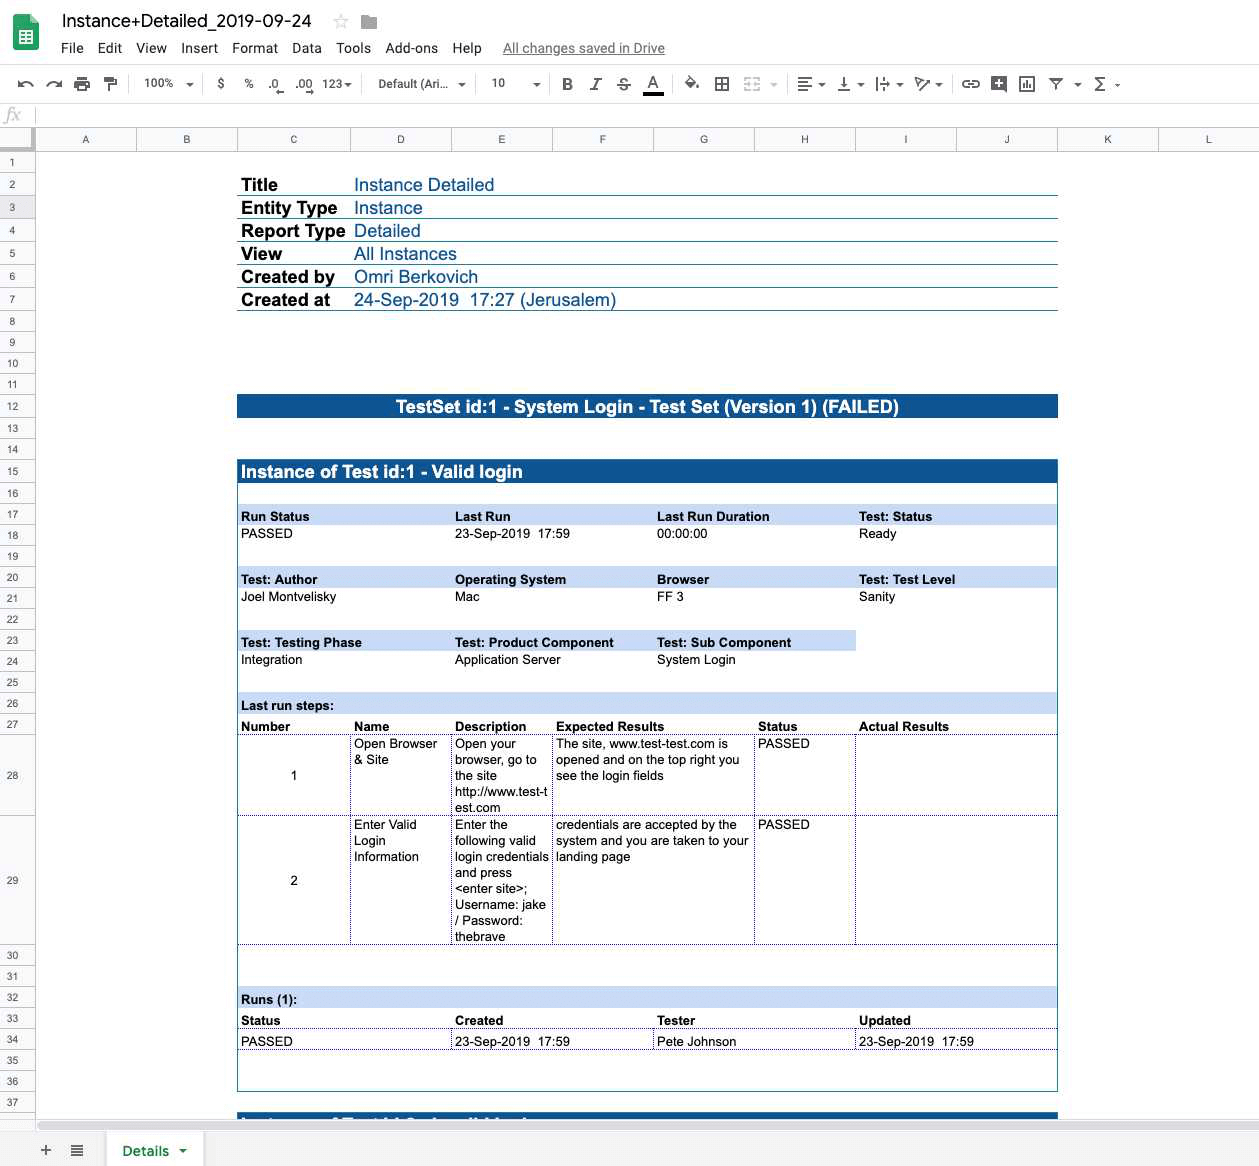
Instance Detailed Report
Detailed reports support both Excel and PDF formats. You can see all the selected instance details, including linked issues. In the reports settings, schedule the report, focus it on a specific Test Sets & Runs filter, and decide whom to notify by email once the report is ready.
Issues
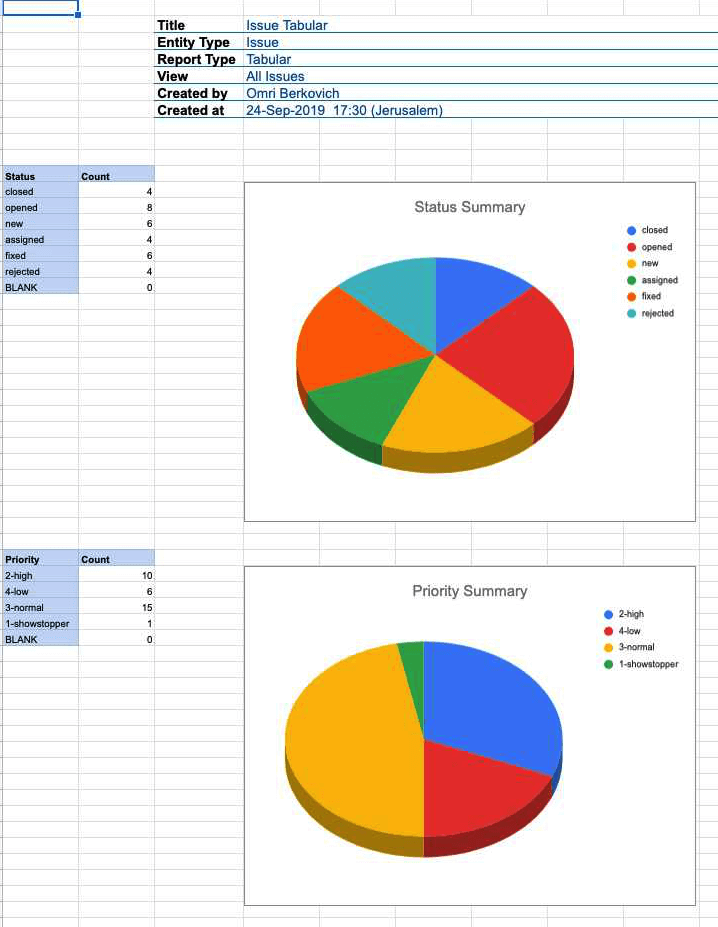
Issues Tabular Report
In this example, you can see the Summaries tab of the report, with the visual representation of the data you selected. On the data tab, you can see all the detailed data you selected to appear in the report.
In the report’s settings, select the columns that should appear in the data tab, schedule the report, select the charts, focus it on a specific Issues filter, and decide whom to notify by email once the report is ready.
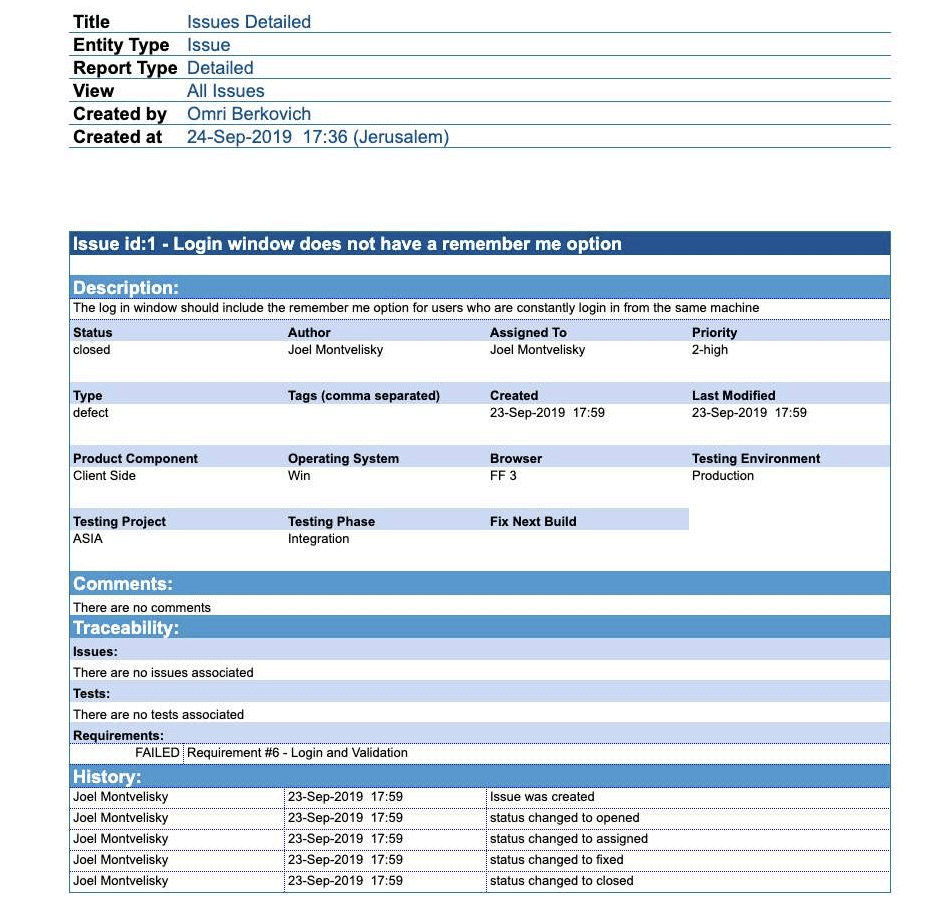
Issues Detailed Report
Detailed reports support both Excel and PDF formats. You can see all the selected Issues details, including linked tests and requirements.
In the report’s settings, schedule the report, focus it on a specific Issues filter, and decide whom to notify by email once the report is ready.
Tests
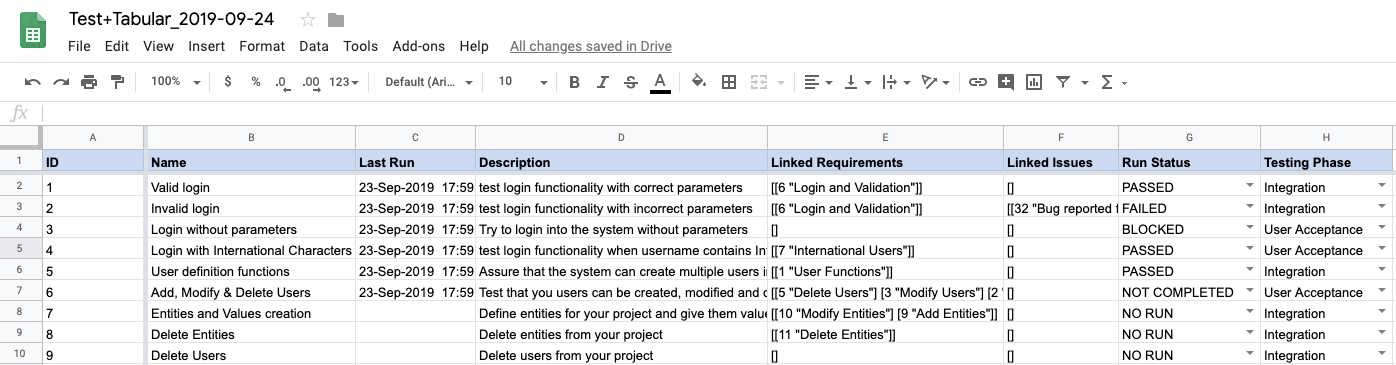
Tests Tabular Report
In this example, you can see the data tab of the report with all the details you selected to appear in the report. On the summaries tab, you will see a visual representation of the report’s data.
On the reports settings, you can select the columns that would appear in the data tab, schedule the report, select the charts, focus it on a specific Test Library filter and decide who to notify by email when the report is ready.
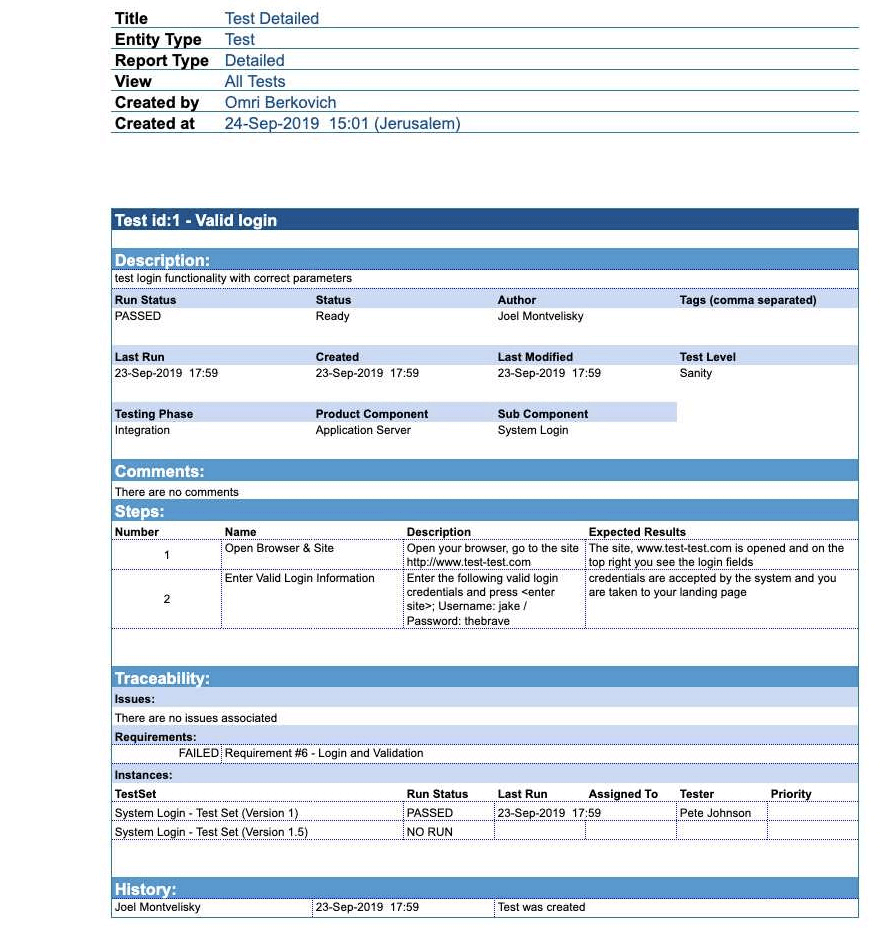
Tests Detailed Report
Detailed reports support both Excel and PDF formats. In the report, you can see all the selected Test Cases details, including linked requirements and issues, and all the relevant run data for each of the cases.
In the report’s settings, schedule the report, focus it on a specific Test Library filter, and decide whom to notify by email once the report is ready.
Test Sets
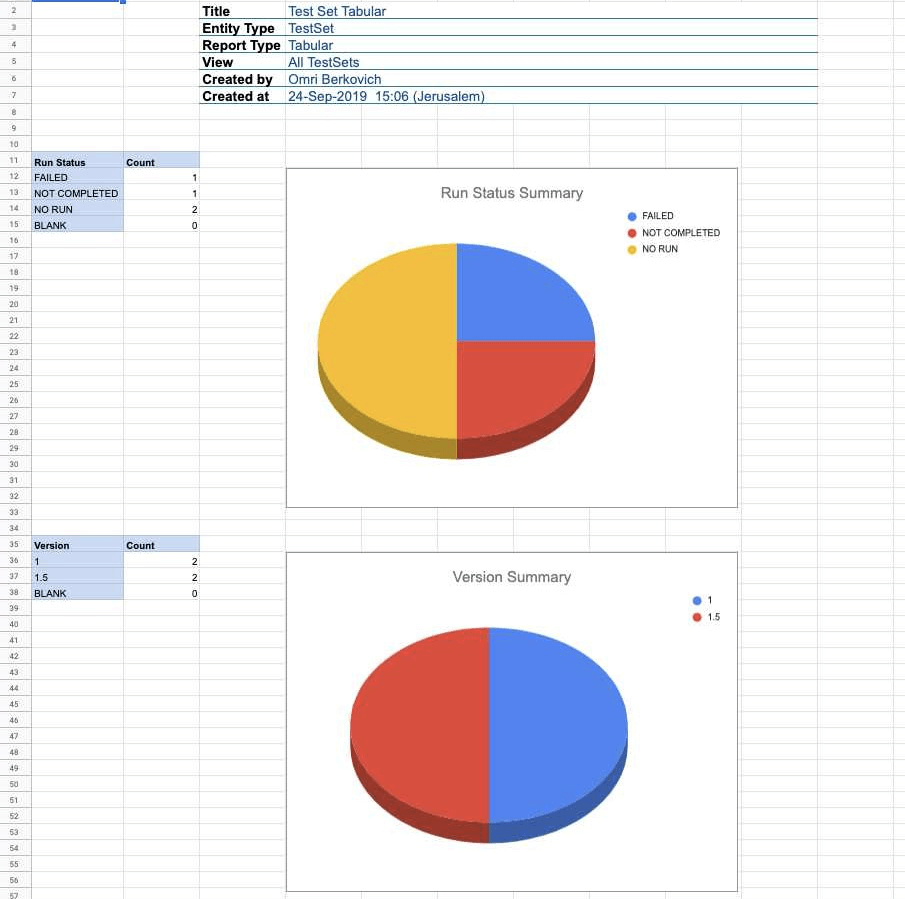
Test Sets Tabular Report
In this example, you can see the Summaries tab of the report with the visual representation of the data. On the data tab, you can see the detailed data you selected to appear in the report. In the report’s settings, select the columns that should appear in the data tab, schedule the report, select the charts, focus it on a specific Test Sets & Runs filter, and decide whom to notify by email once the report is ready.
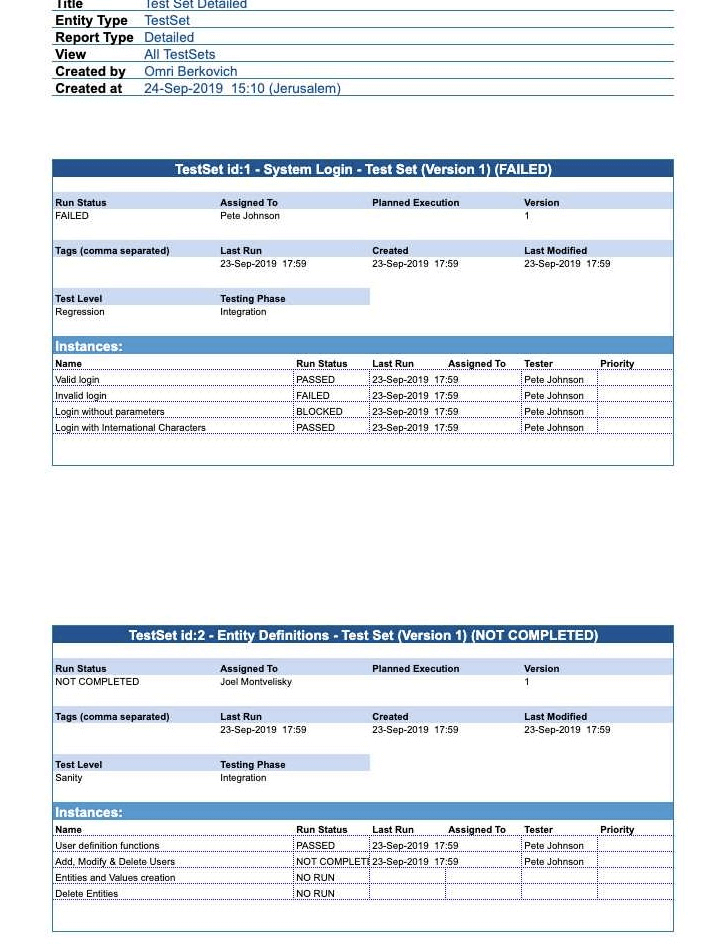
Test Set Detailed Report
Detailed reports support both Excel and PDF formats. You can see the selected Test Sets details, including information on the instances that reside in each test set. In the report’s settings, schedule the report, focus it on a specific Test Sets & Runs filter, and decide whom to notify by email once the report is ready.
Requirements
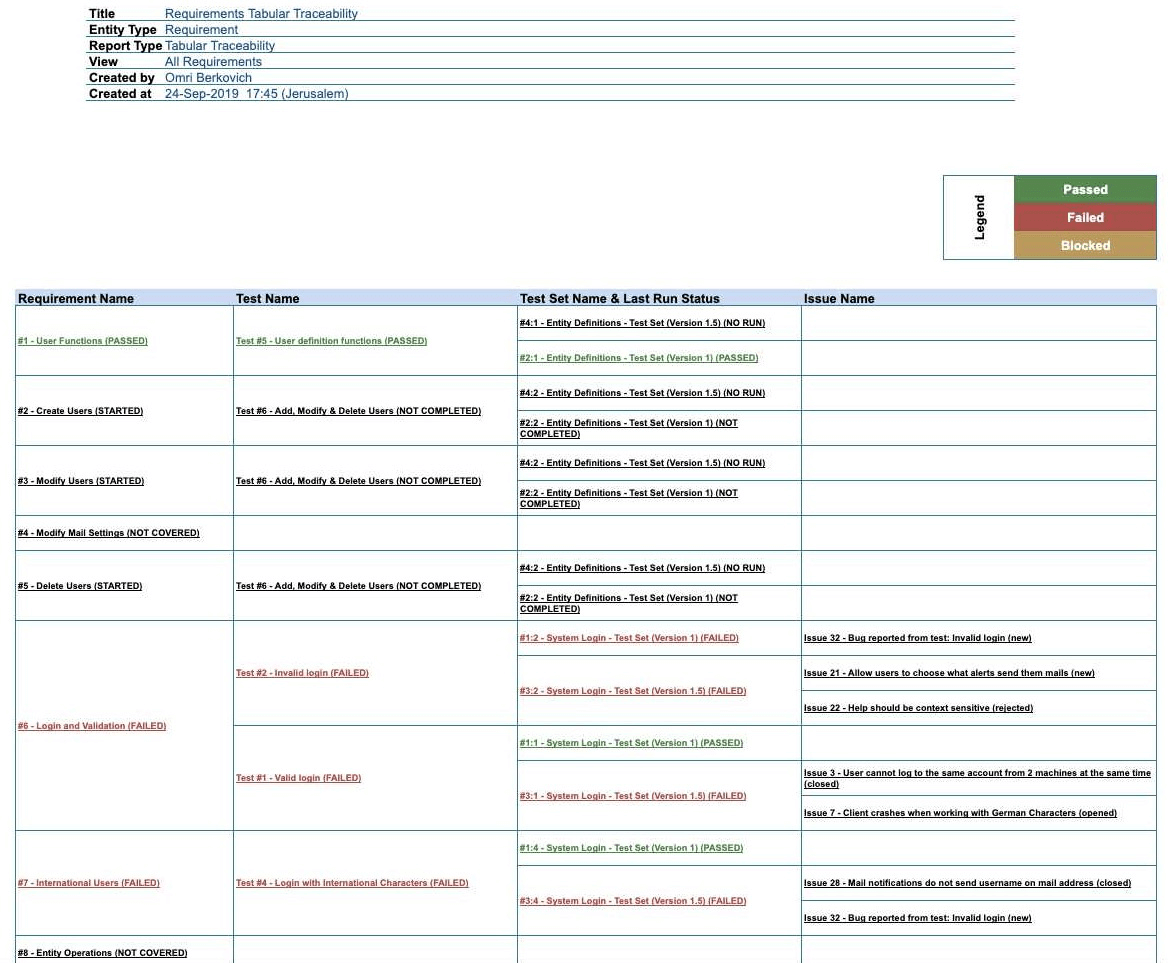
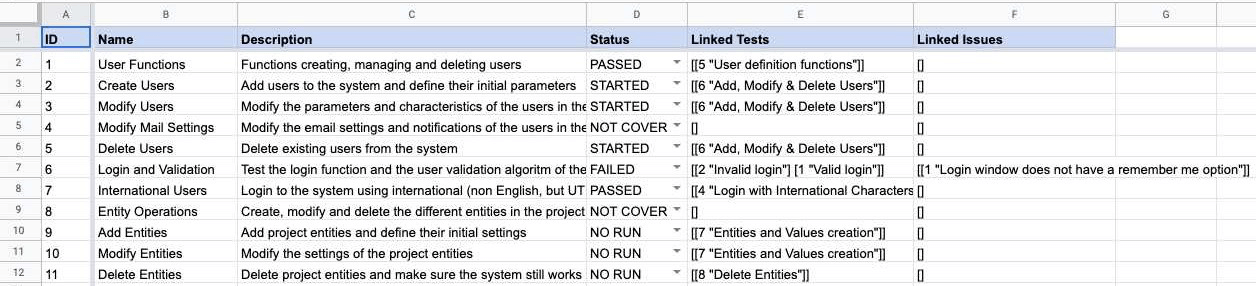
Requirements Tabular Traceability Report
This report presents the entire traceability workflow, starting from Requirements through Issues. You will be able to see all test cases which are linked to each requirement, all test sets which these test cases were added to as test instances, and finally all the issues which were reported from these instances.
Requirements Tabular Report
In this example, you can see the data tab of the report with all the details you selected. On the summaries tab, you will see a visual representation of the report’s data. In the report’s settings, select the columns that should appear in the data tab, schedule the report, select the charts, focus it on a specific Requirements filter, and decide whom to notify by email once the report is ready.
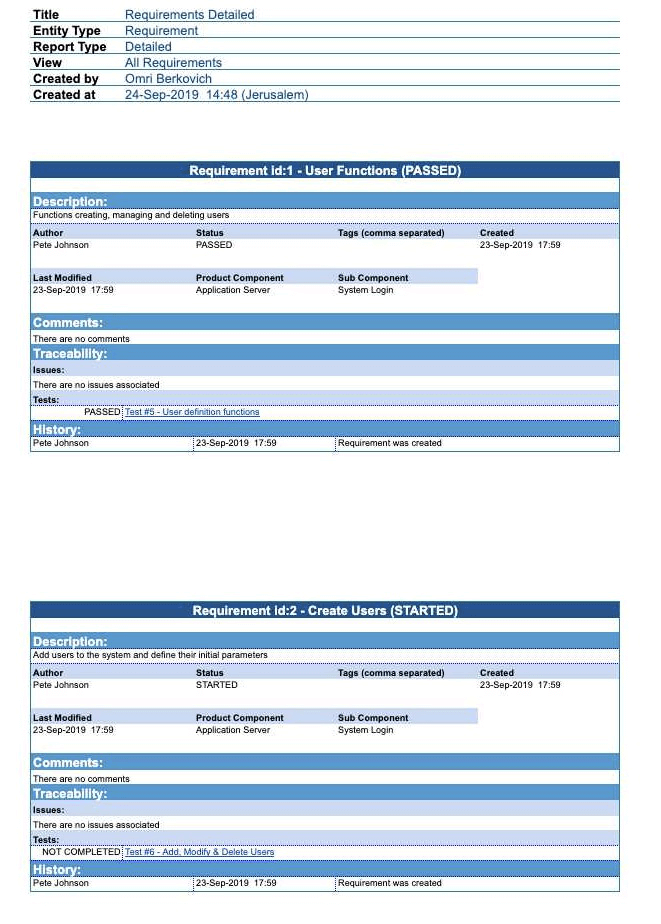
Requirements Detailed Report
Detailed reports support both Excel and PDF formats. You can see the selected requirement details, including linked tests and issues, and all the relevant run data for each case. In the report’s settings, schedule the report, focus it on a specific Requirements filter, and decide whom to notify by email once the report is ready.
Runs
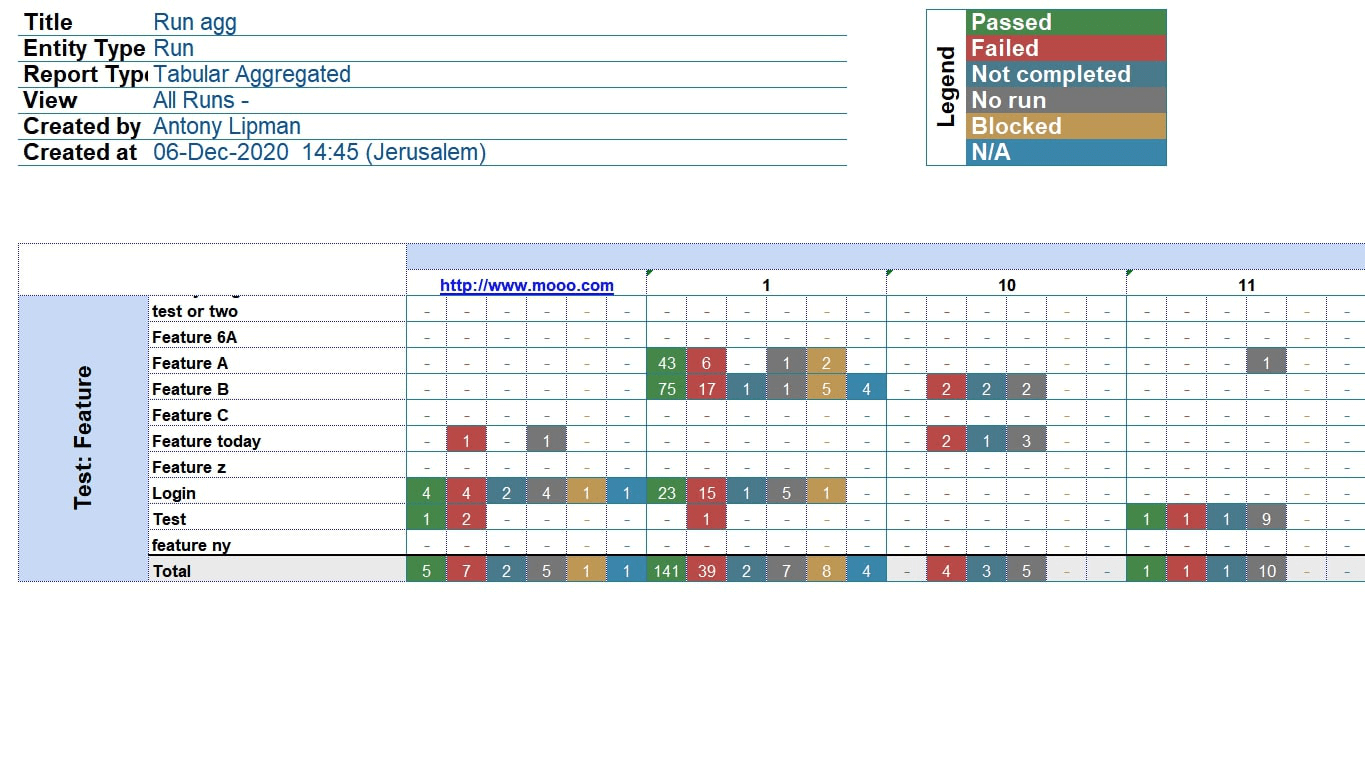
Runs Tabular Aggregated Report
This report can only be based on custom fields of List or Linked List types. You can create this report solely based on one field, or choose to aggregate the test instances based on two fields. You can read more about Tabular Aggregated Reports in this Instances section or here.
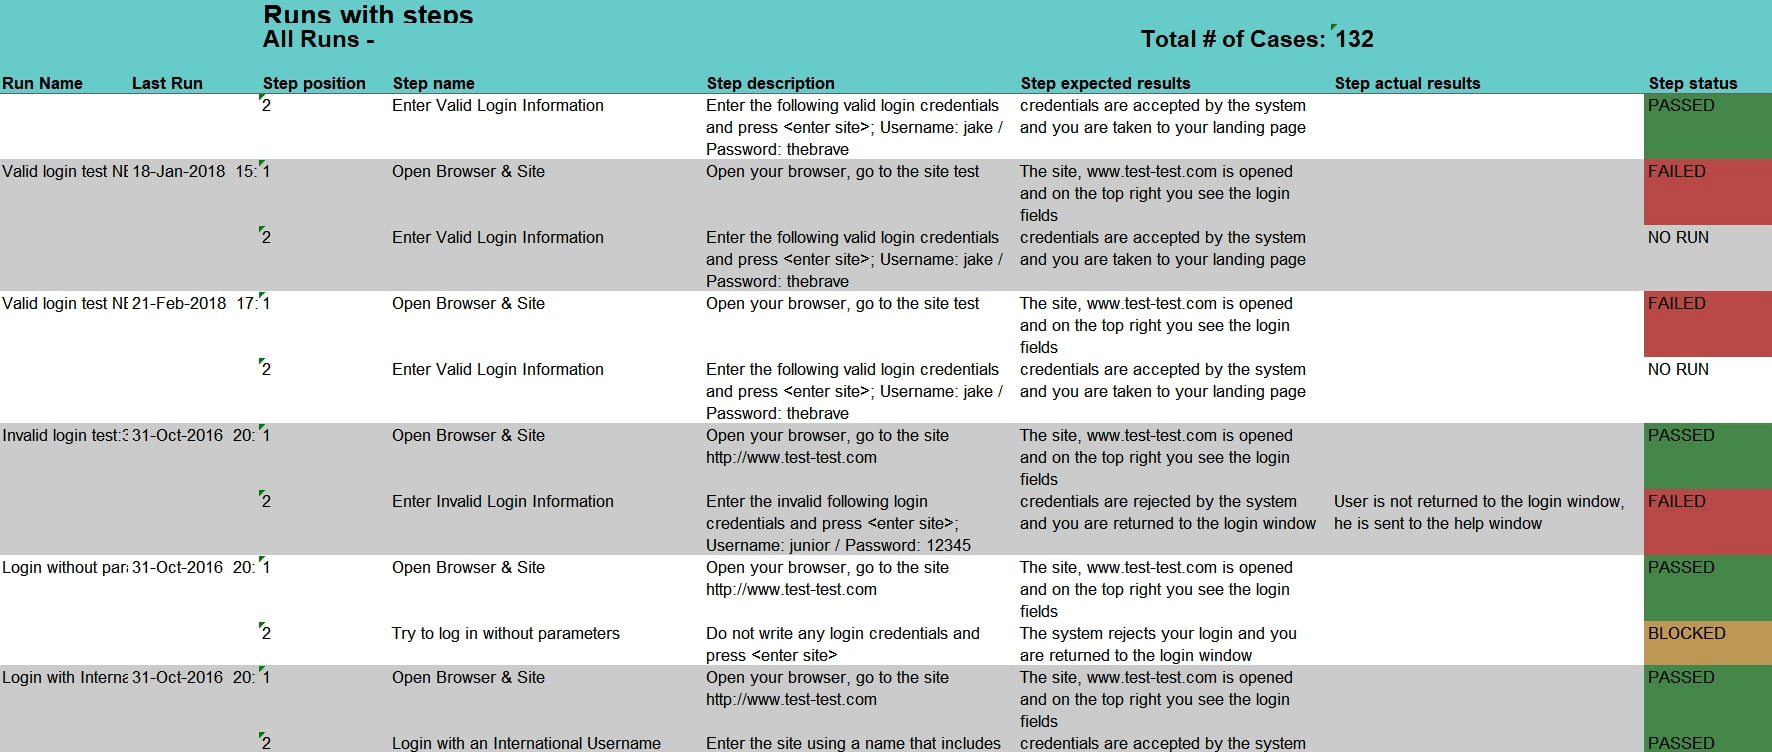
Runs Tabular with Steps Report
In this example, you can see the data tab of the report. On the other tabs you can find charts (preselected in the report’s settings) and issues related to the selected test instances. In the report’s settings, select the columns that should appear in the data tab, schedule the report, select the charts, focus it on a specific Test Sets & Runs filter, and decide whom to notify by email once the report is ready. Learn more about Tabular with Steps Reports here.
Runs Tabular Report
In this example, you can see the data tab of the report with the detailed data you selected to appear in the report. On the summaries tab, you will see a visual representation of the report data. In the report’s settings, select the columns that should appear in the data tab, schedule the report, select the charts, focus it on a specific Test Sets & Runs filter, and decide whom to notify by email once the report is ready.